
Home | Patient satisfaction survey 2025
Fact Checked
This article has been fact checked by a licensed expert before publication to ensure all information provided is correct and safe.
Patient satisfaction survey 2025
We believe that good health should be a two-way conversation. That’s why we periodically ask you, our patients, to let us know what you think of our service and how we can improve. We asked questions on:
- Our core service
- Managing your treatment with us
- Our staff and quality of care
- Health advice
- Overall satisfaction
Go to
We also gave you the opportunity to give detailed feedback. And while we aren’t able to address every single concern here, please know that we appreciate your support in helping us do healthcare better, and that we’ve read and understood your comments.
140 of you responded, here are the results.
How did we do?
Broadly, a large majority of respondents indicated they were pleased with our service.
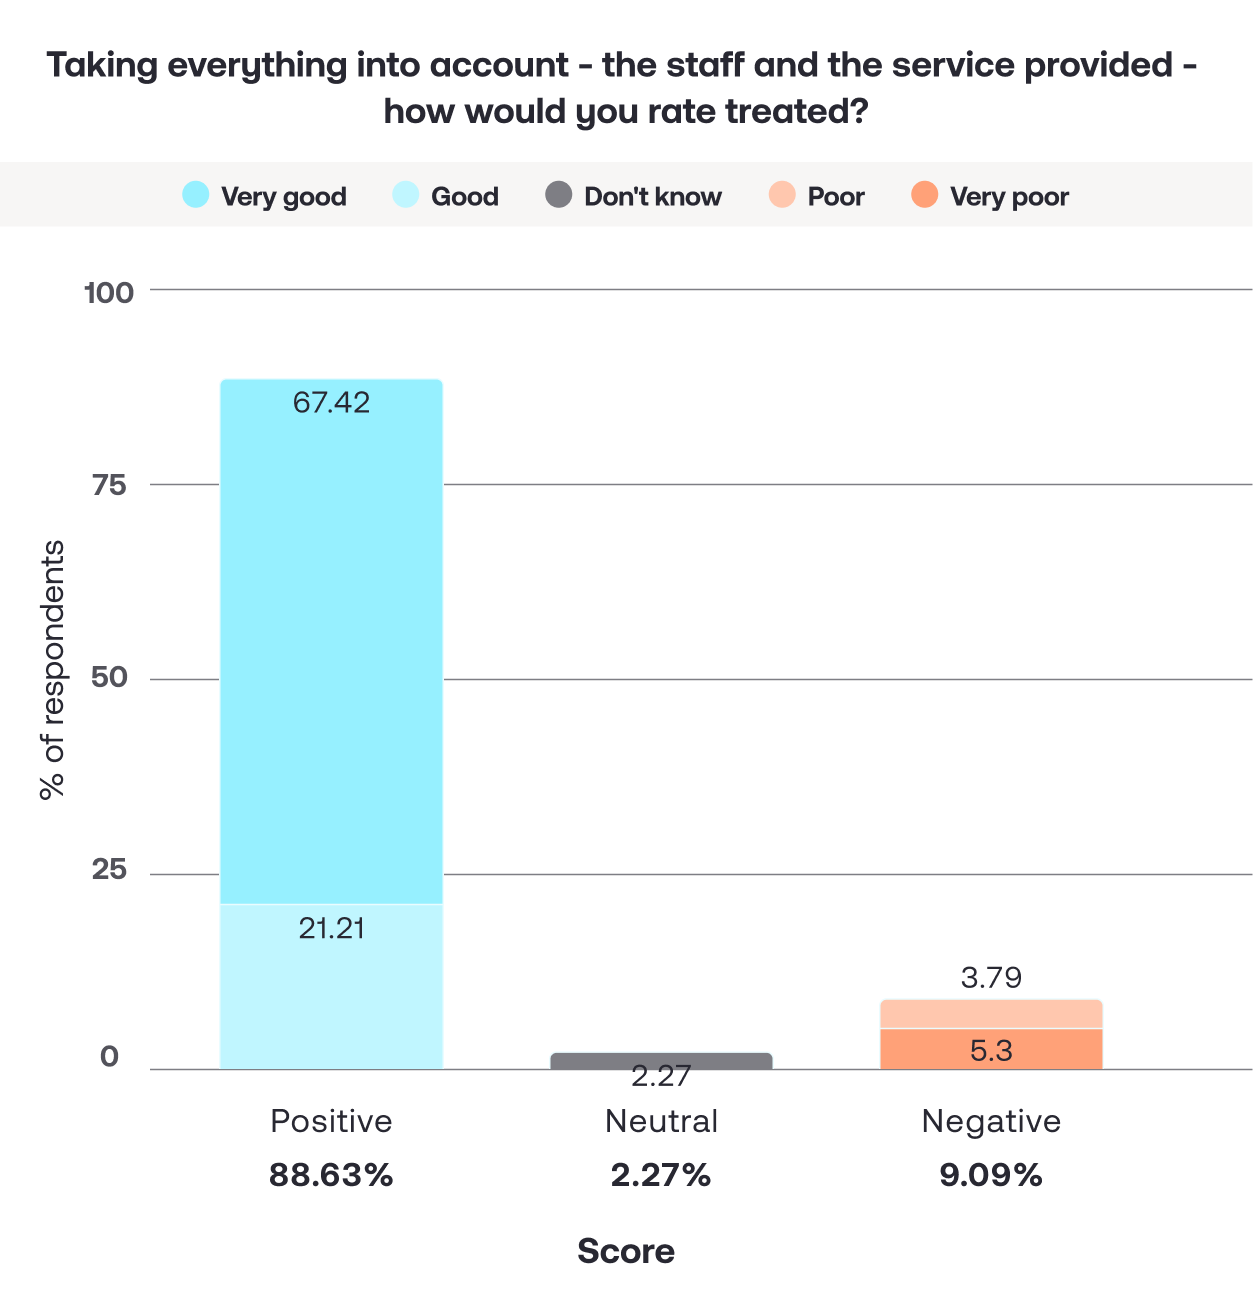
👍Overall, 88.6% of respondents rated Treated as “Very good” (67.42%) or “Good” (21.21%).
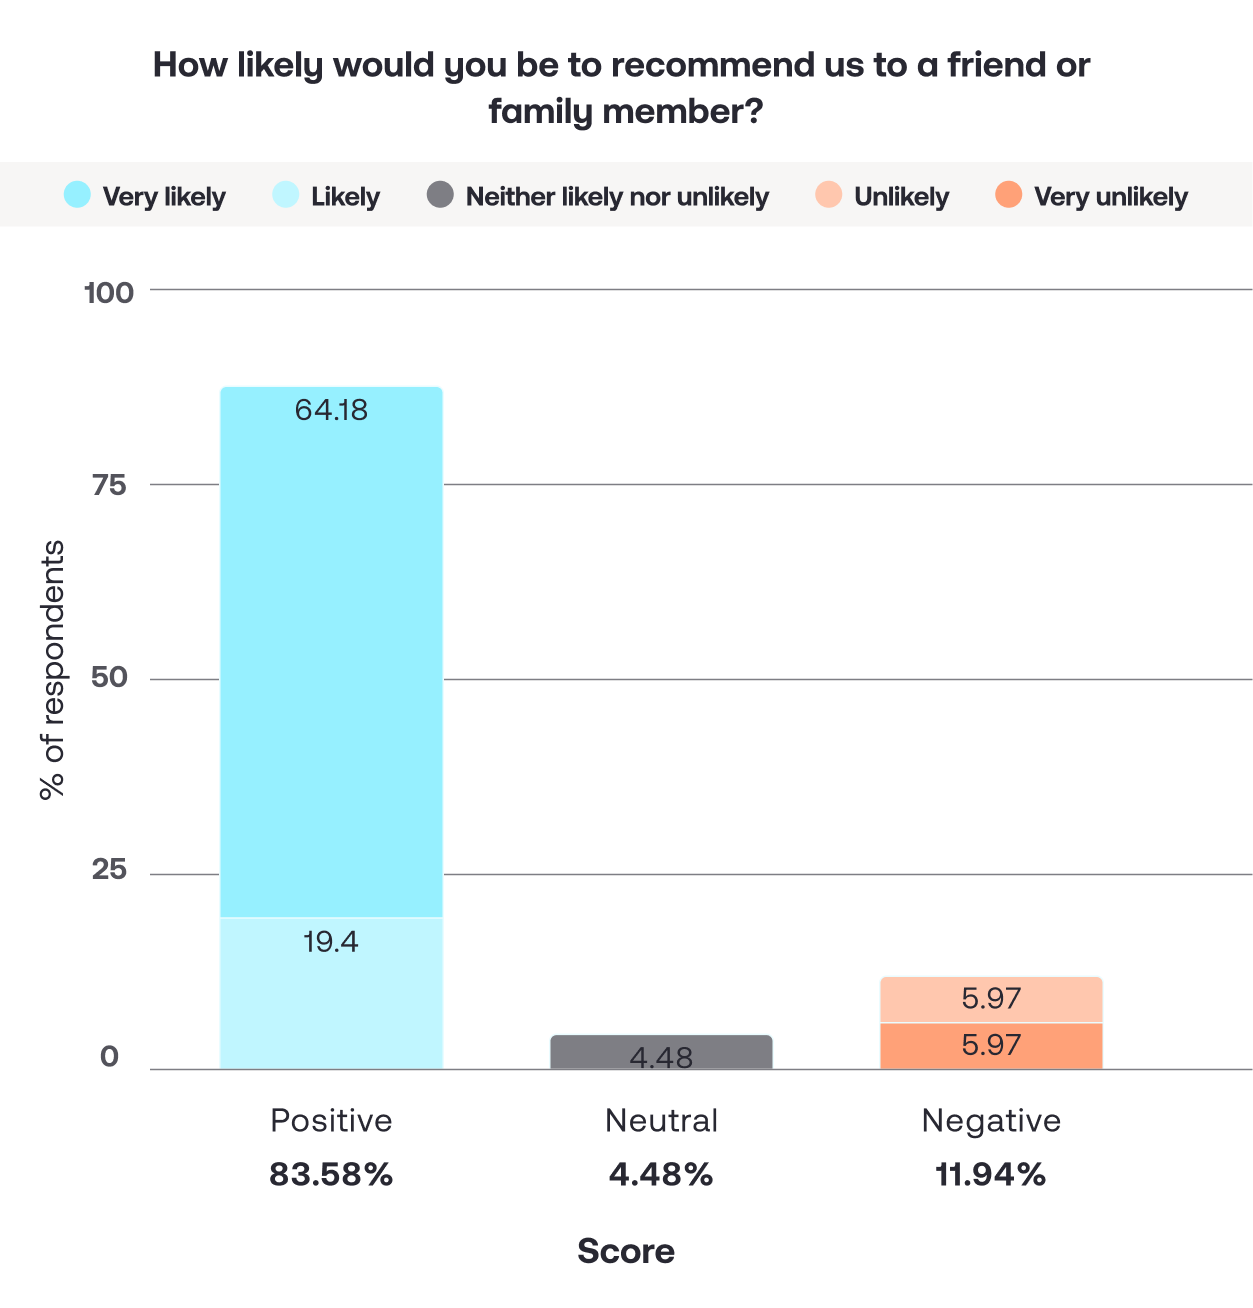
👍83.6% of respondents were “Very likely” (64.18%) or “Likely” (19.40%) to recommend us.
👍83.3% of respondents confirmed the treatment they ordered was effective.
While in an ideal world we’d like to score top marks in every metric, positive scores mean we’re having a broadly positive impact on the health of patients and on their lives.
Here are some key strengths:
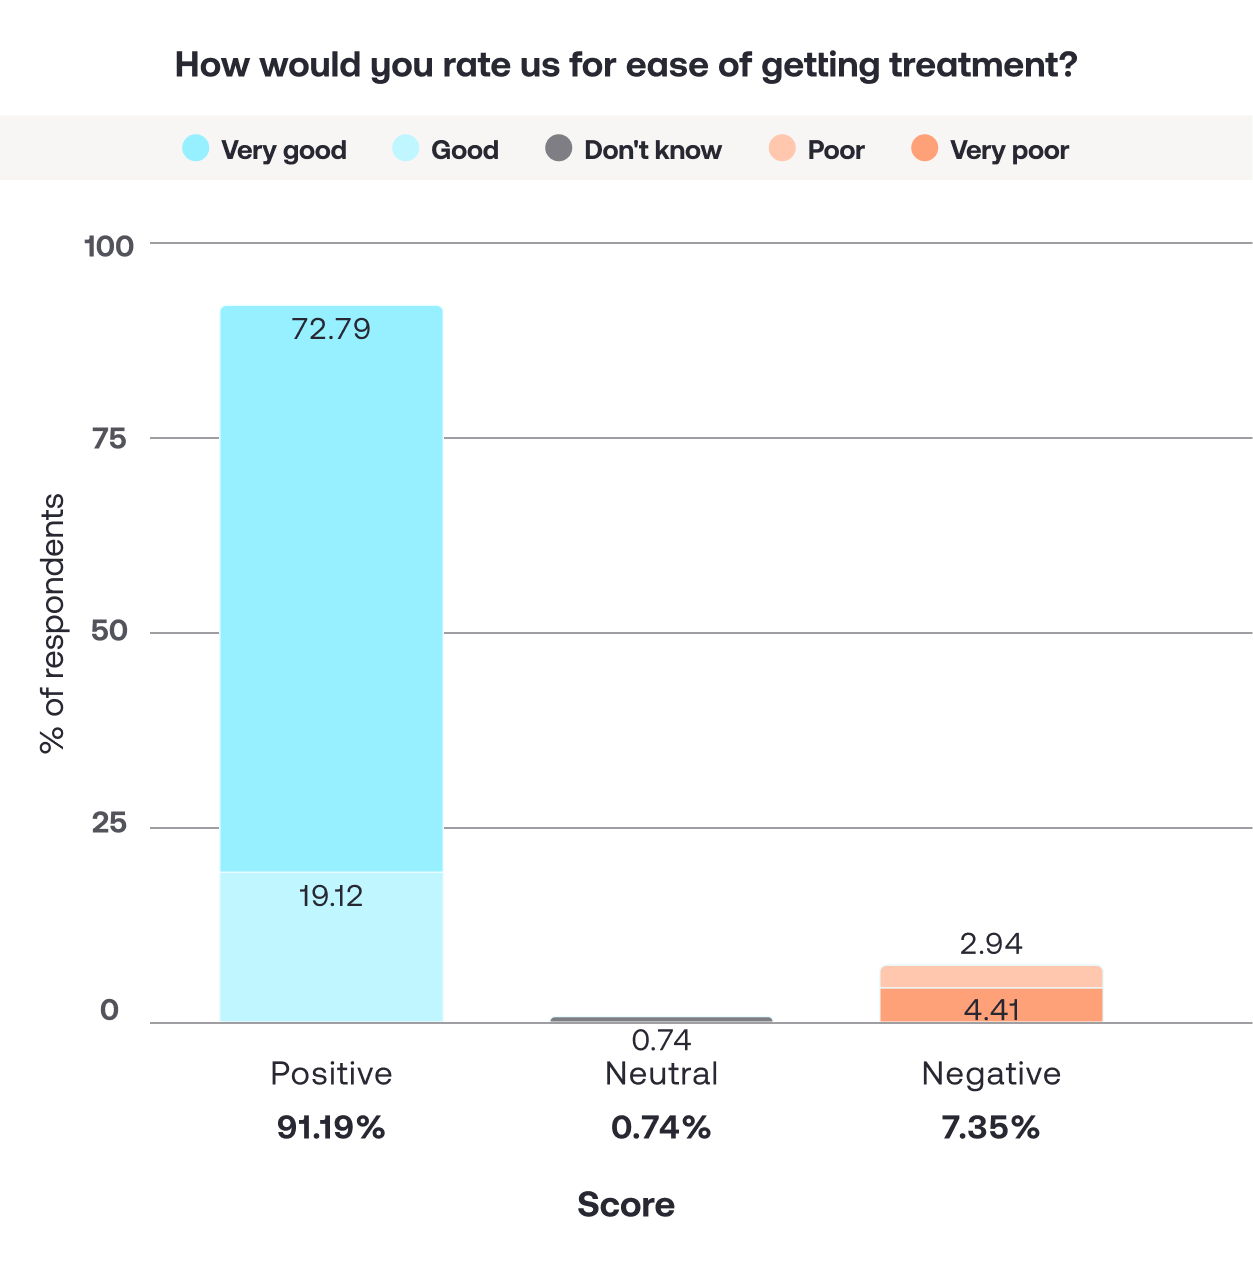
- Ease of getting treatment: 91.9% rated this “Very good” or “Good”.
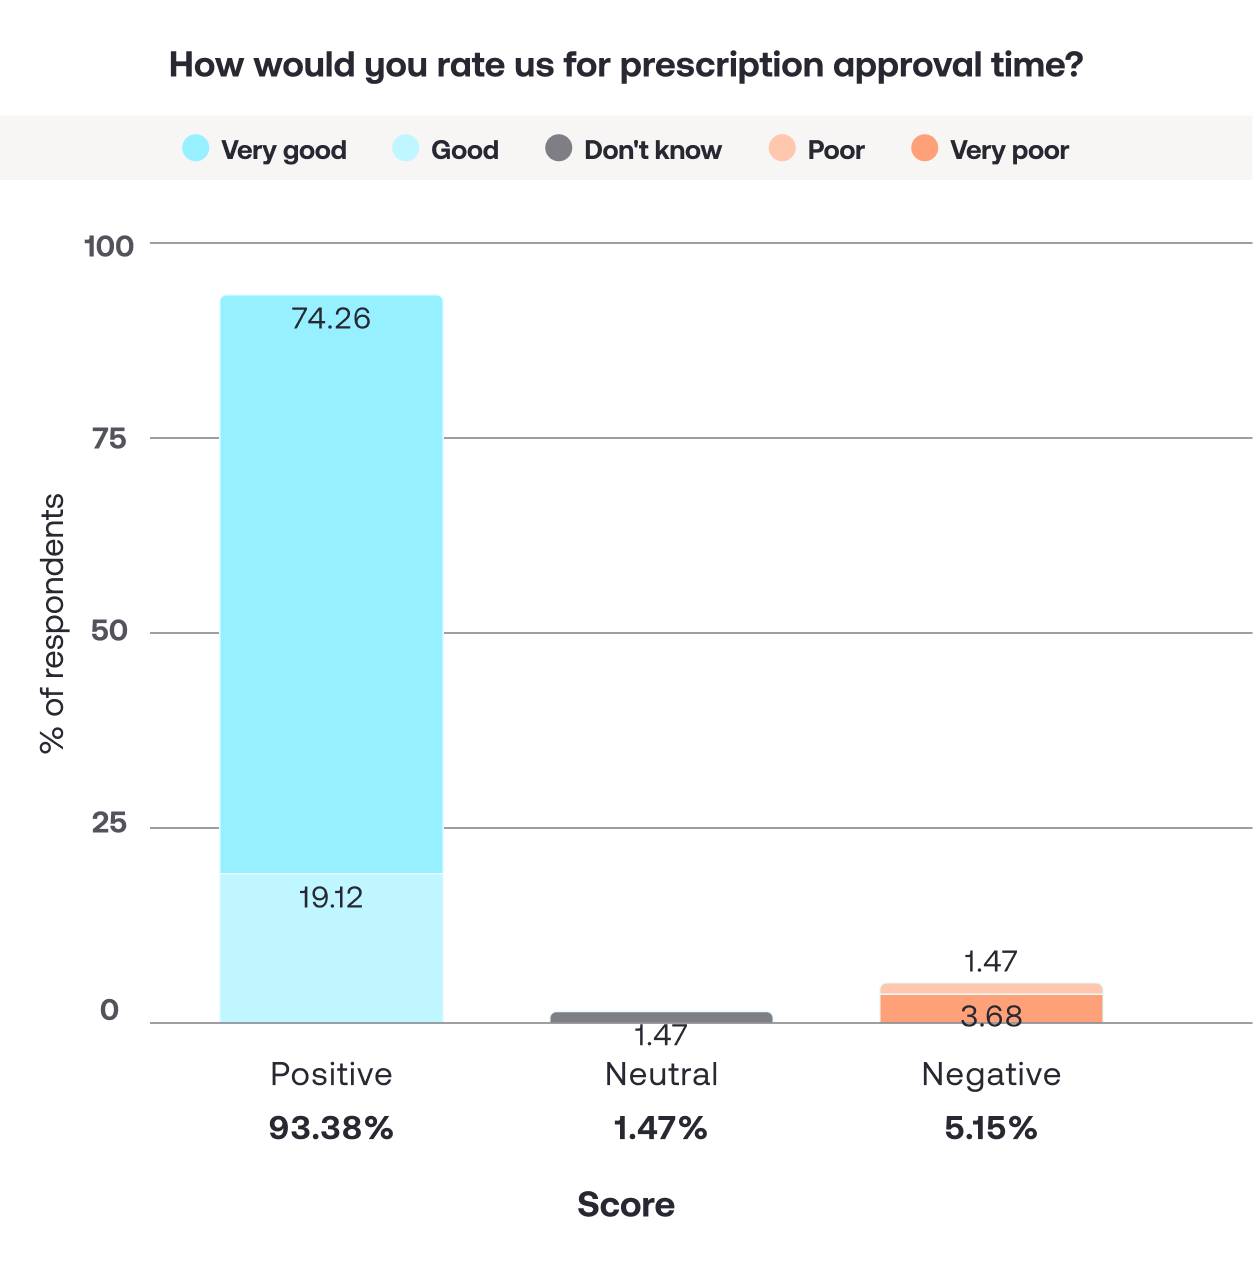
- Prescription approval time: 93.4% rated this “Very good” or “Good”.
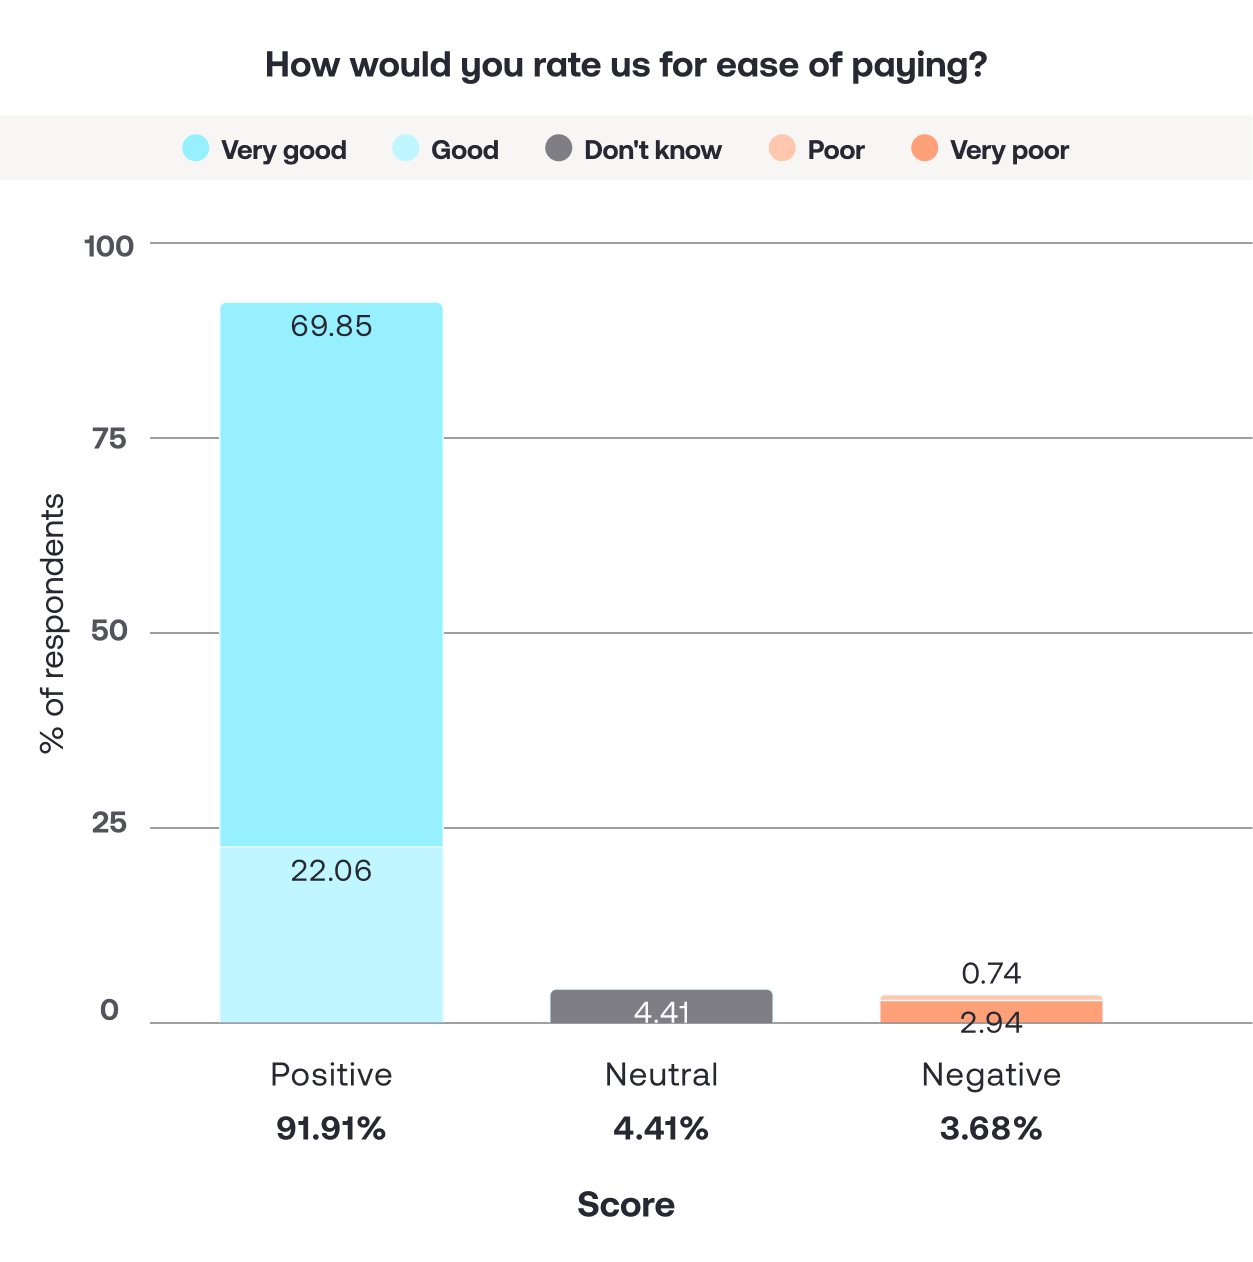
- Ease of payment: 91.9% rated this “Very good” or “Good”, with over 93% stating it was “easy”.
- Delivery: 88.8% rated delivery as “Very good” or “Good”.
And the consensus seemed to be that our subscriptions and communications around these are clear:
- 84.6% “Strongly agree” or “Agree” that it was clear they were getting a subscription.
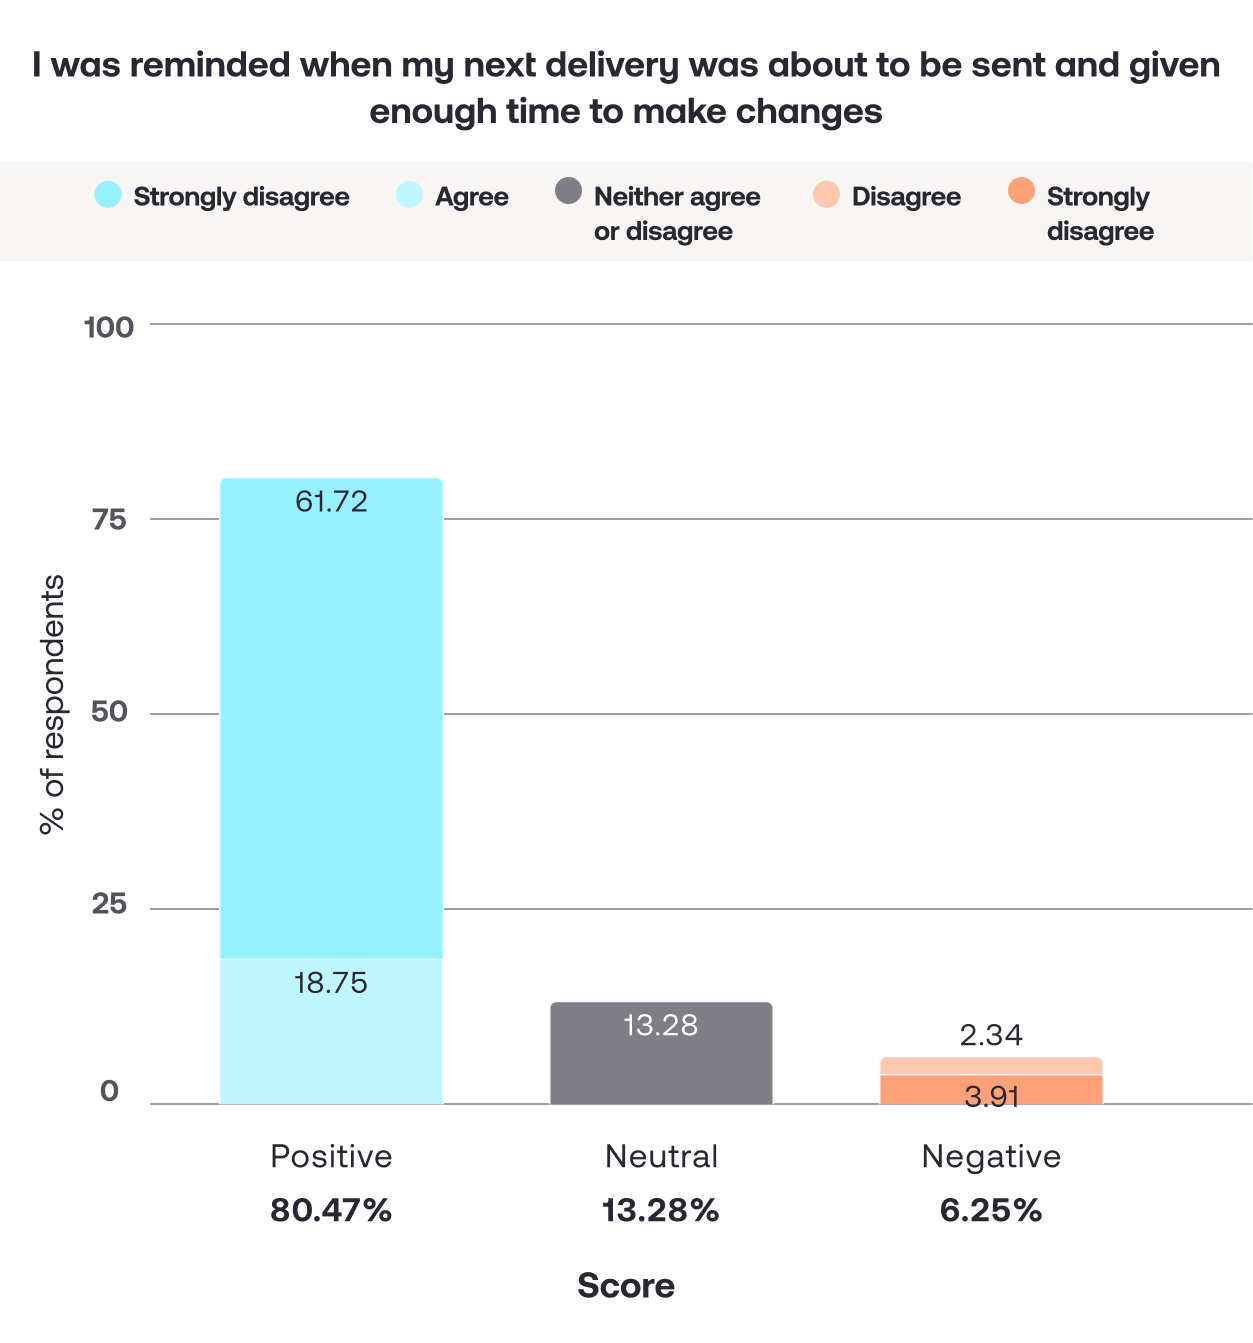
- 80.5% “Strongly agree” or “Agree” they were reminded about their next delivery with enough time to make changes.
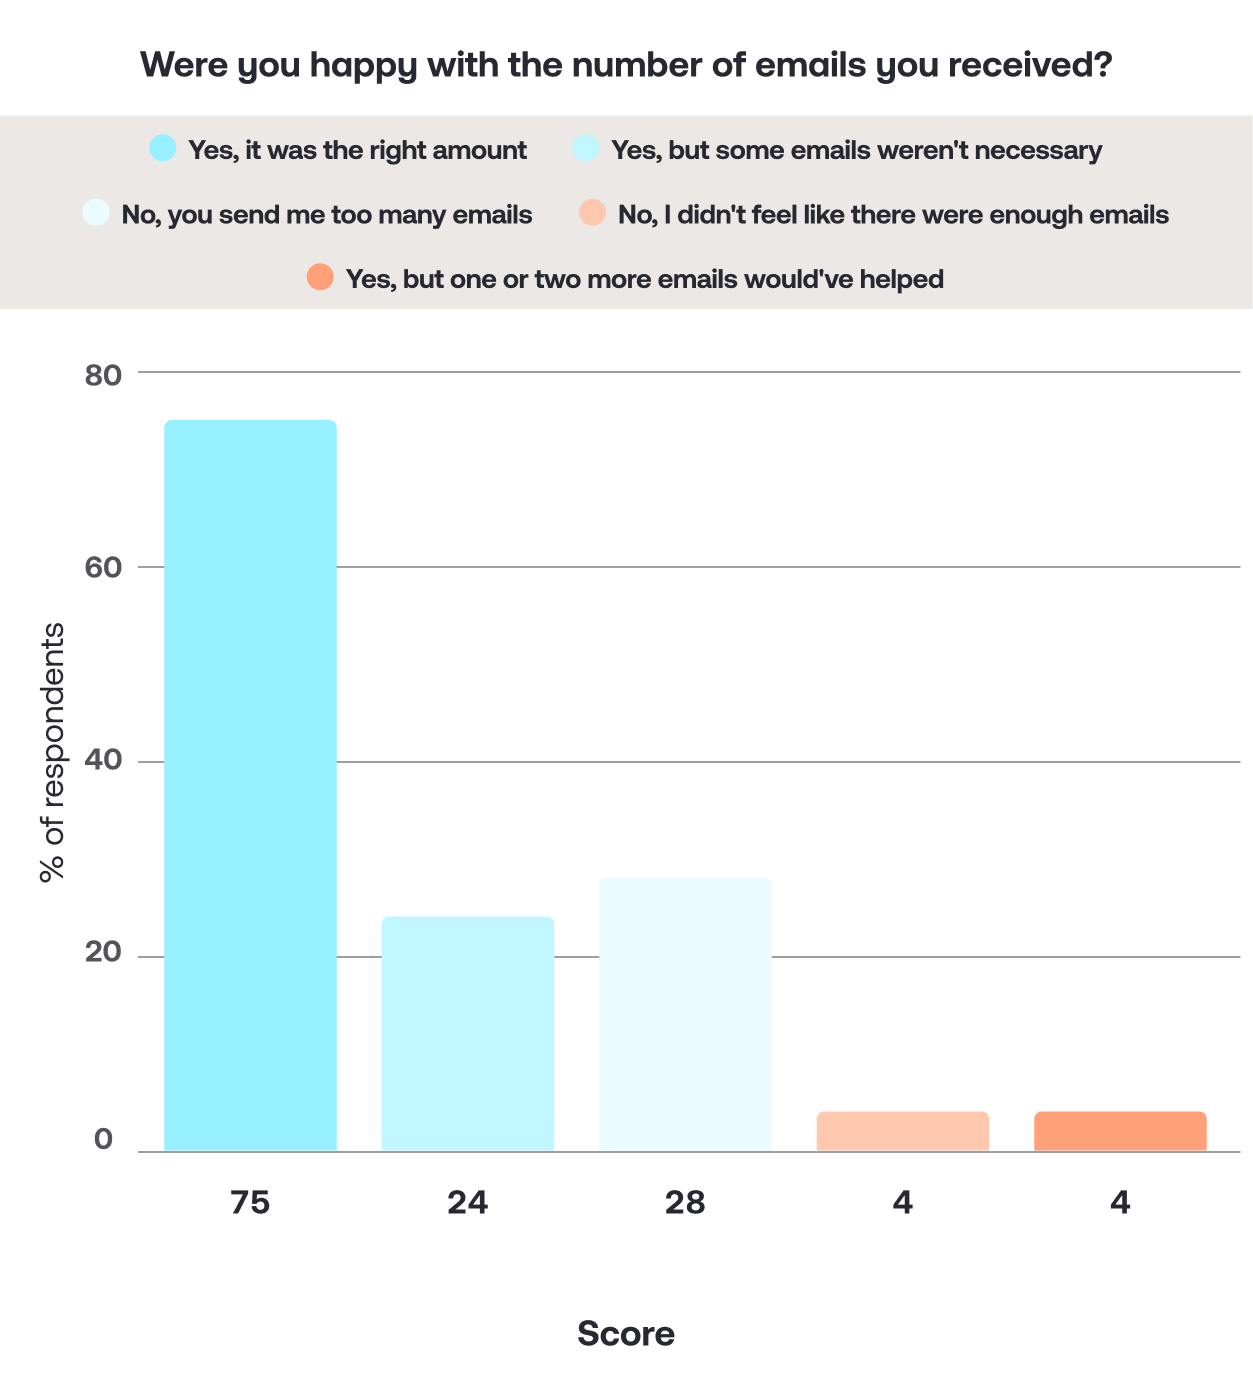
- 81.5% of respondents felt the number of emails they received was “the right amount”.
And what are the opportunities?
We thought about the 11% of patients who didn’t score us highly overall.
One of the reasons patients gave us low scores is when we declined a request for medication. Sometimes we have to say ‘No’ when people ask us for treatment — and while we’d love to make everyone satisfied with our service, it’s vital that we prioritise safety first and foremost. And sometimes this means that online treatment isn’t the best option for our patients.
Another particular area for consideration seemed to be proactive health advice.
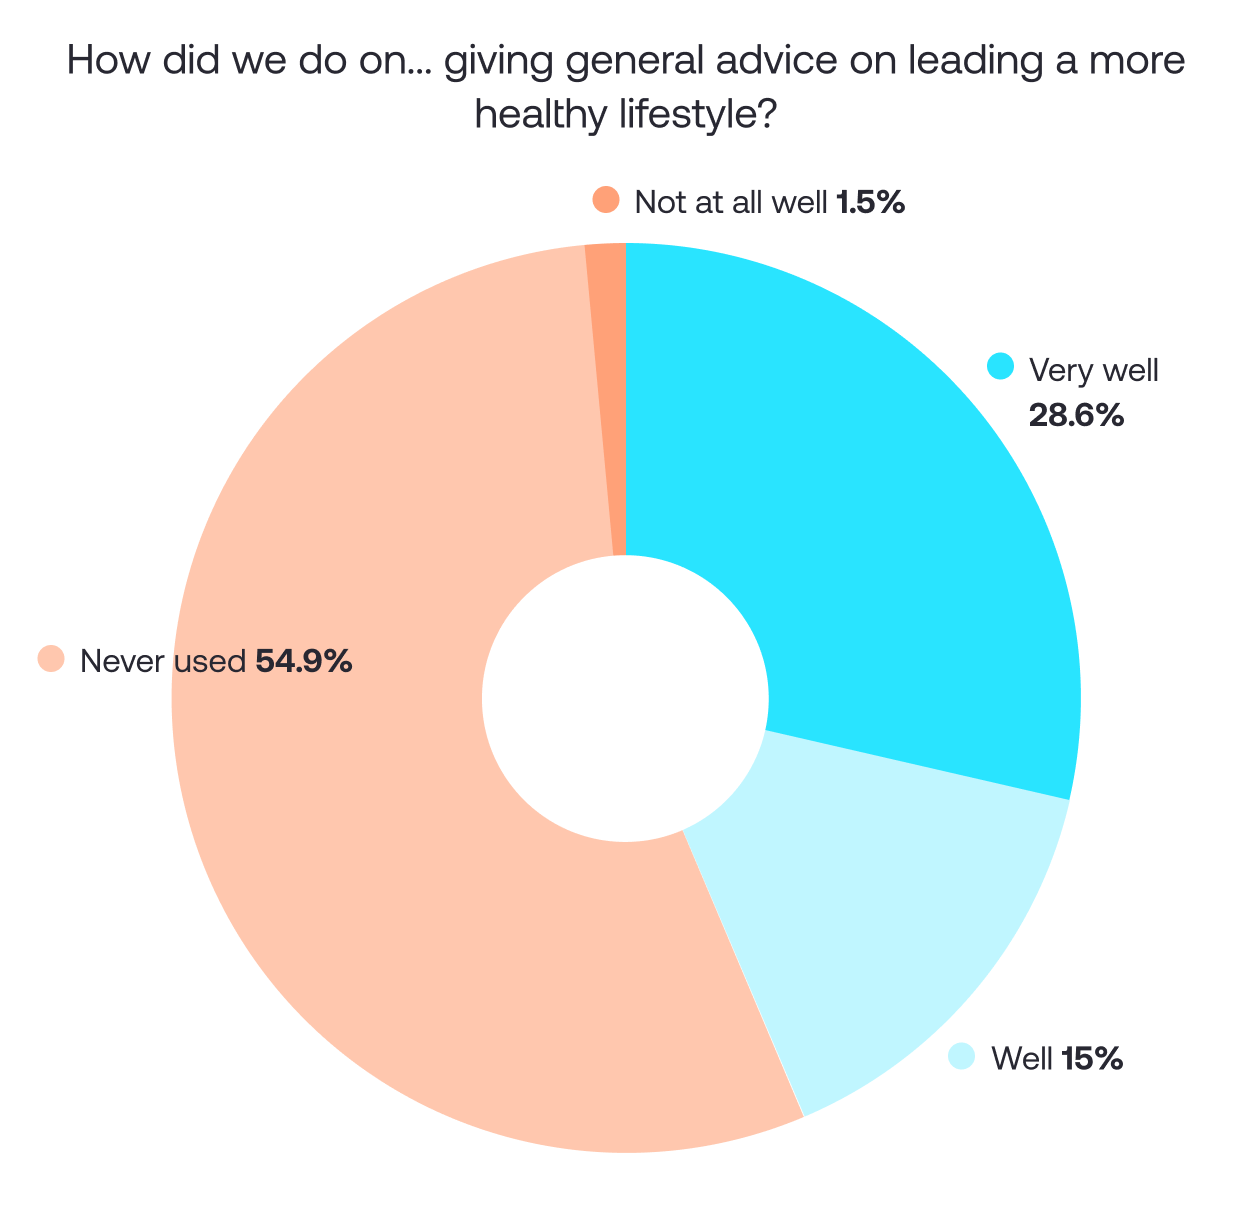
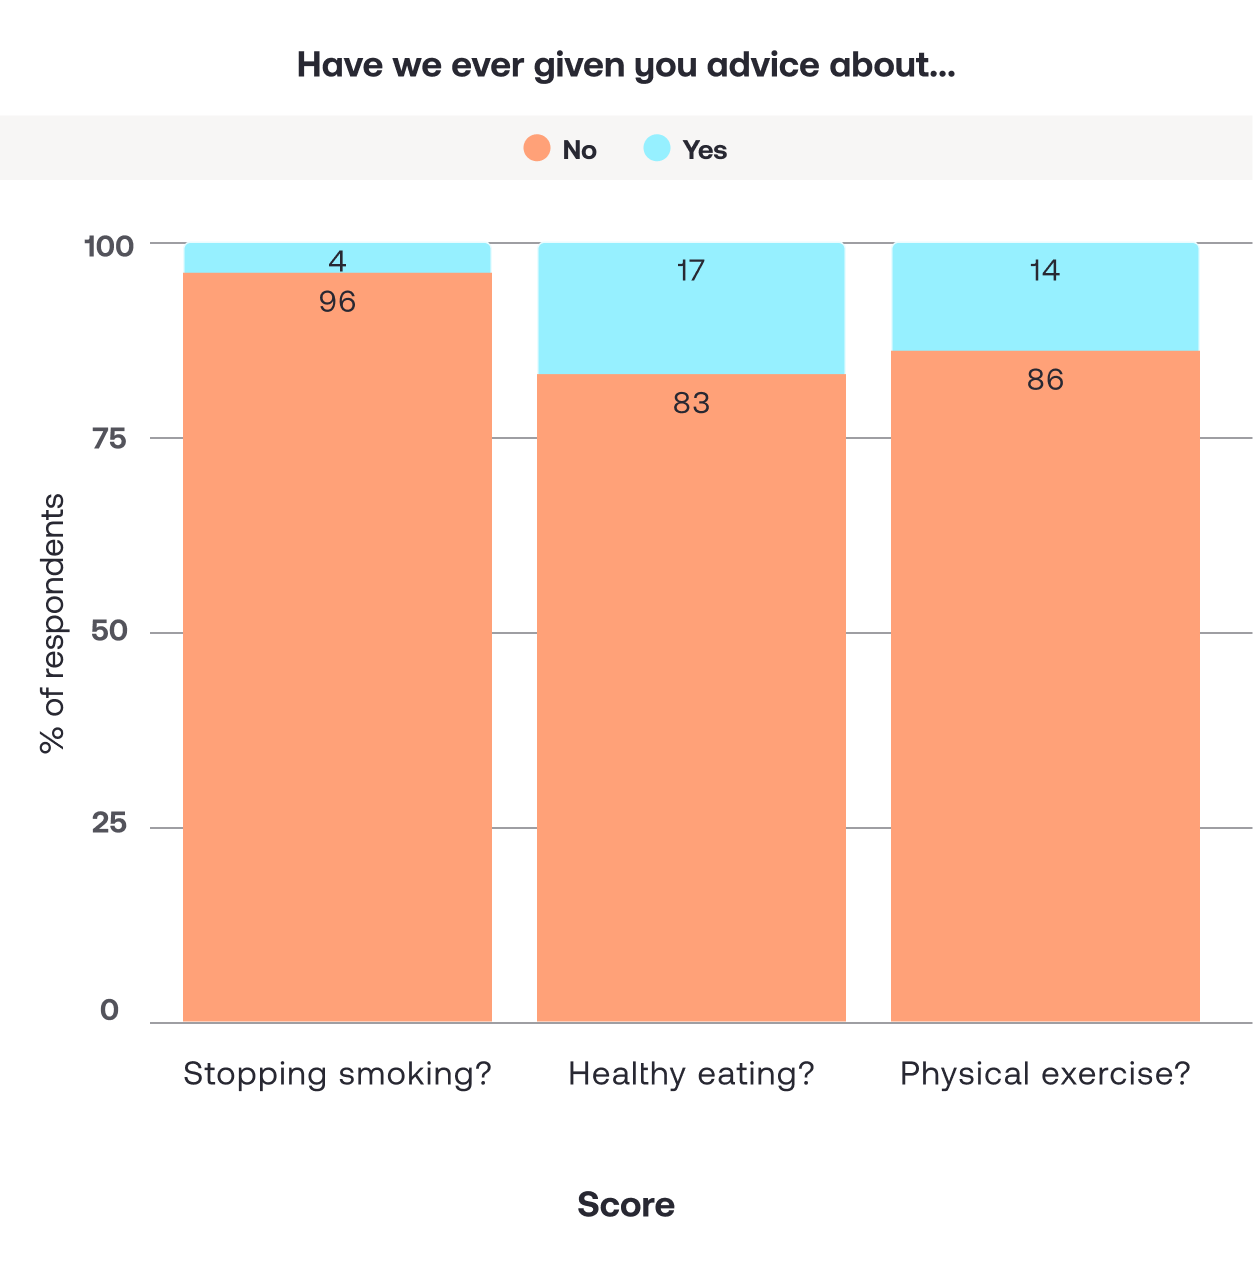
- 54.9% of respondents said they “Never used” our general healthy lifestyle advice. And more specifically, when asked “Have we ever given you advice about…”
- Stop smoking: 96.2% said “No”
- Physical exercise: 86.3% said “No”
- Healthy eating: 82.6% said “No”
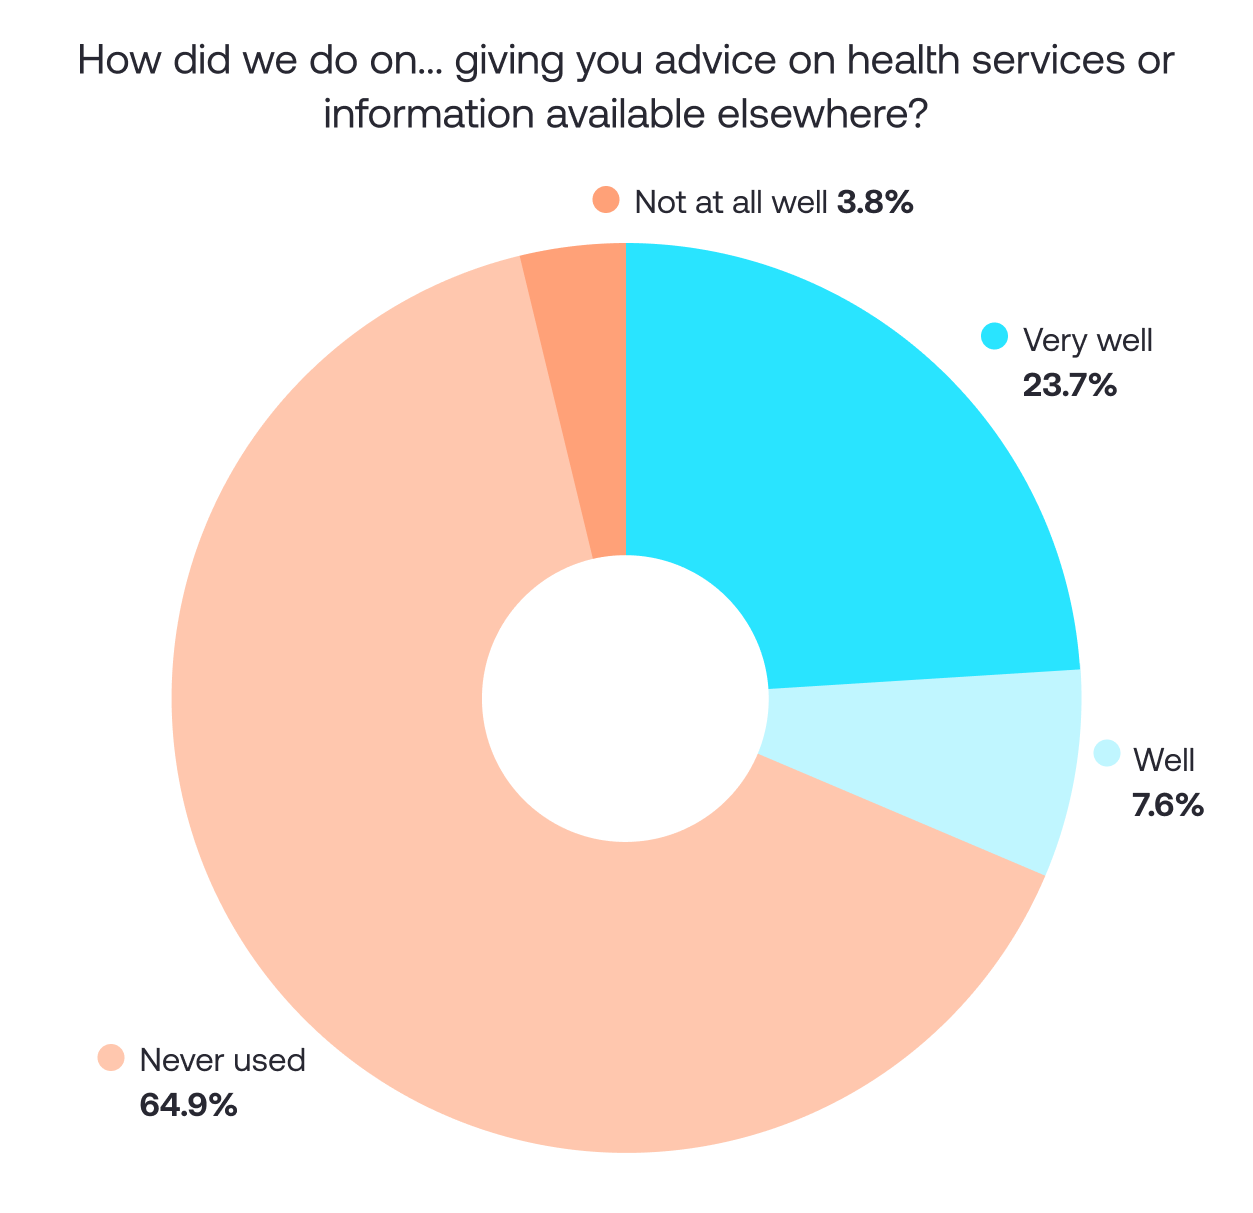
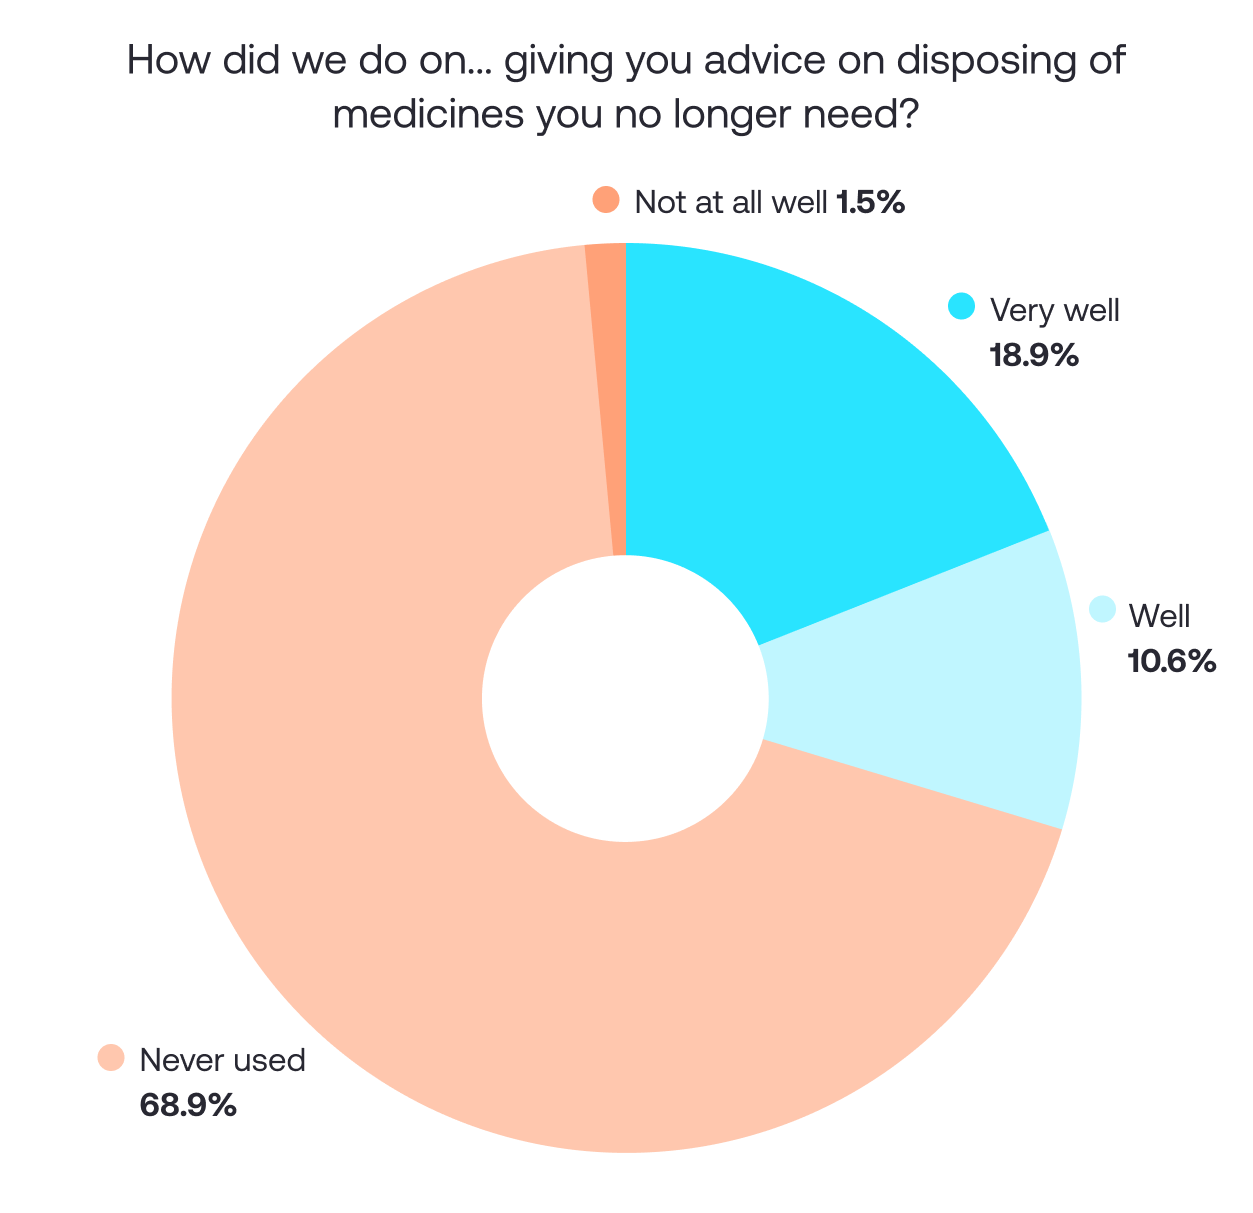
- 68.9% of respondents had “Never used” advice on disposing of medicines and 64.9% of respondents didn’t use advice on other health services.
While this advice might not have been requested or solicited, there’s a possibility that this advice could have been effective and useful for some respondents. The high proportion of respondents that did not use this advice suggests that we may not be giving it enough prominence. We’ll delve a little deeper into what we’re doing to address this below.
Another opportunity we discovered is in our patient interactions and support:
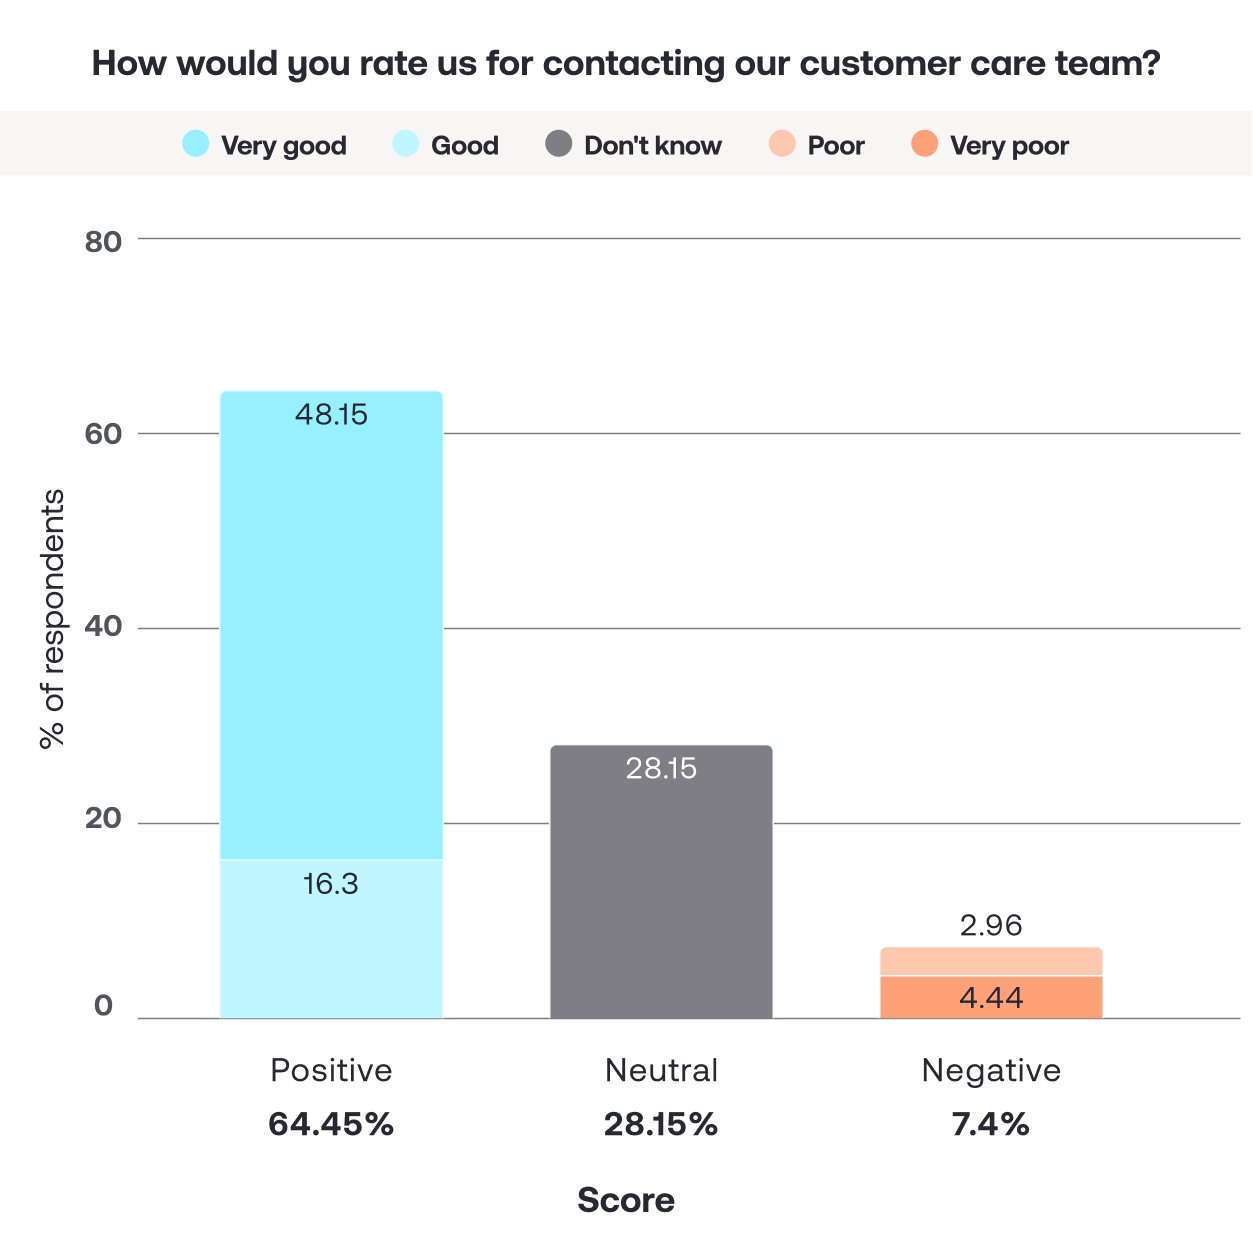
- Only 59.2% of respondents rated us “Very good” or “Good” when it comes to changing a subscription. 64.4% rated us “Very good” or “Good” when it comes to contacting customer care.
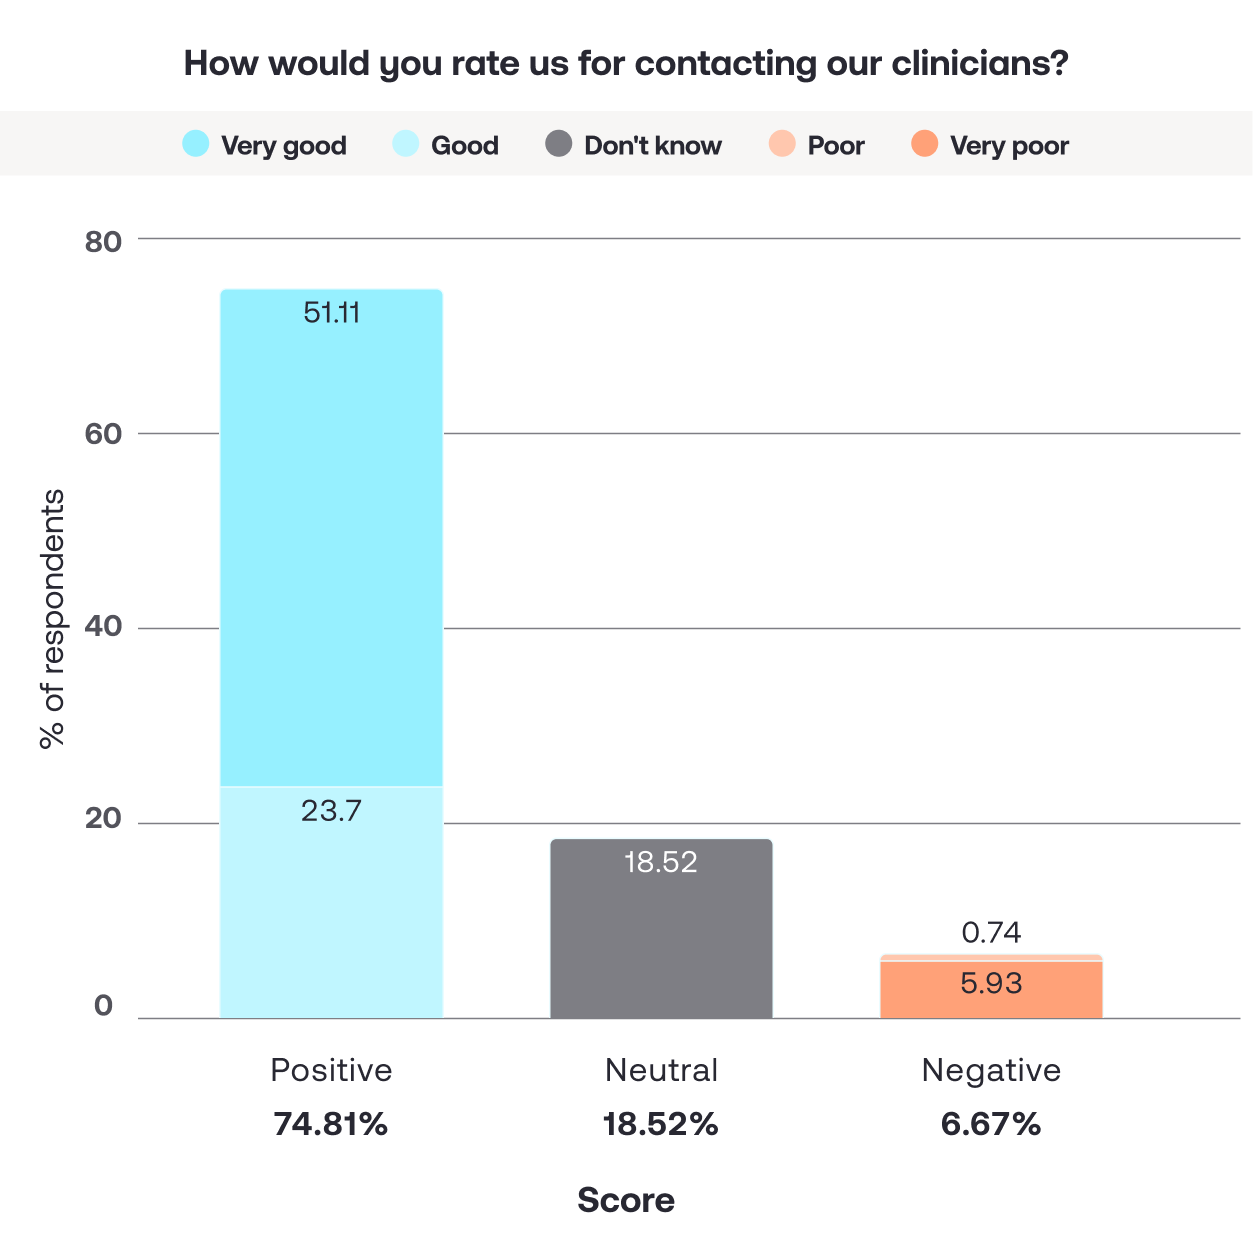
- 74.8% rated us “Very good” or “Good” when it comes to contacting clinicians.
- A large portion of patients (ranging from 18-34%) answered “Don’t know” for these questions, suggesting they have never needed to use these features. However, for those who have, the experience, while still efficient, may not be quite as seamless as the ordering process.
Here are our findings in more detail:
Core service and transactional experience
In this area we asked questions like “How easy is it to get the treatment you need” and “How quickly are we able to approve your prescription”. Your responses to these questions show that this area is our greatest strength.
Let’s evaluate some key questions and how you responded.
- “Ease of getting the treatment you required”
- “Time taken for your prescription to be approved”
- “Availability of the medication you required”
- “Our delivery service”
- “Ease of paying for your medication”
- “Effectiveness of the treatment you ordered”
Overall, our service appears to be performing at a high level.
The data reveals that our transactional processes, from prescription approval to payment and final delivery condition, were perceived to be excellent. Positive ratings (Good + Very good) were consistently above 91% in most areas.
Summary of patient sentiment (ranked by positive score):
| Metric | Positive (Very good + Good) | Negative (Very poor + Poor) |
|---|---|---|
| Prescription approval time | 93.38% | 5.15% |
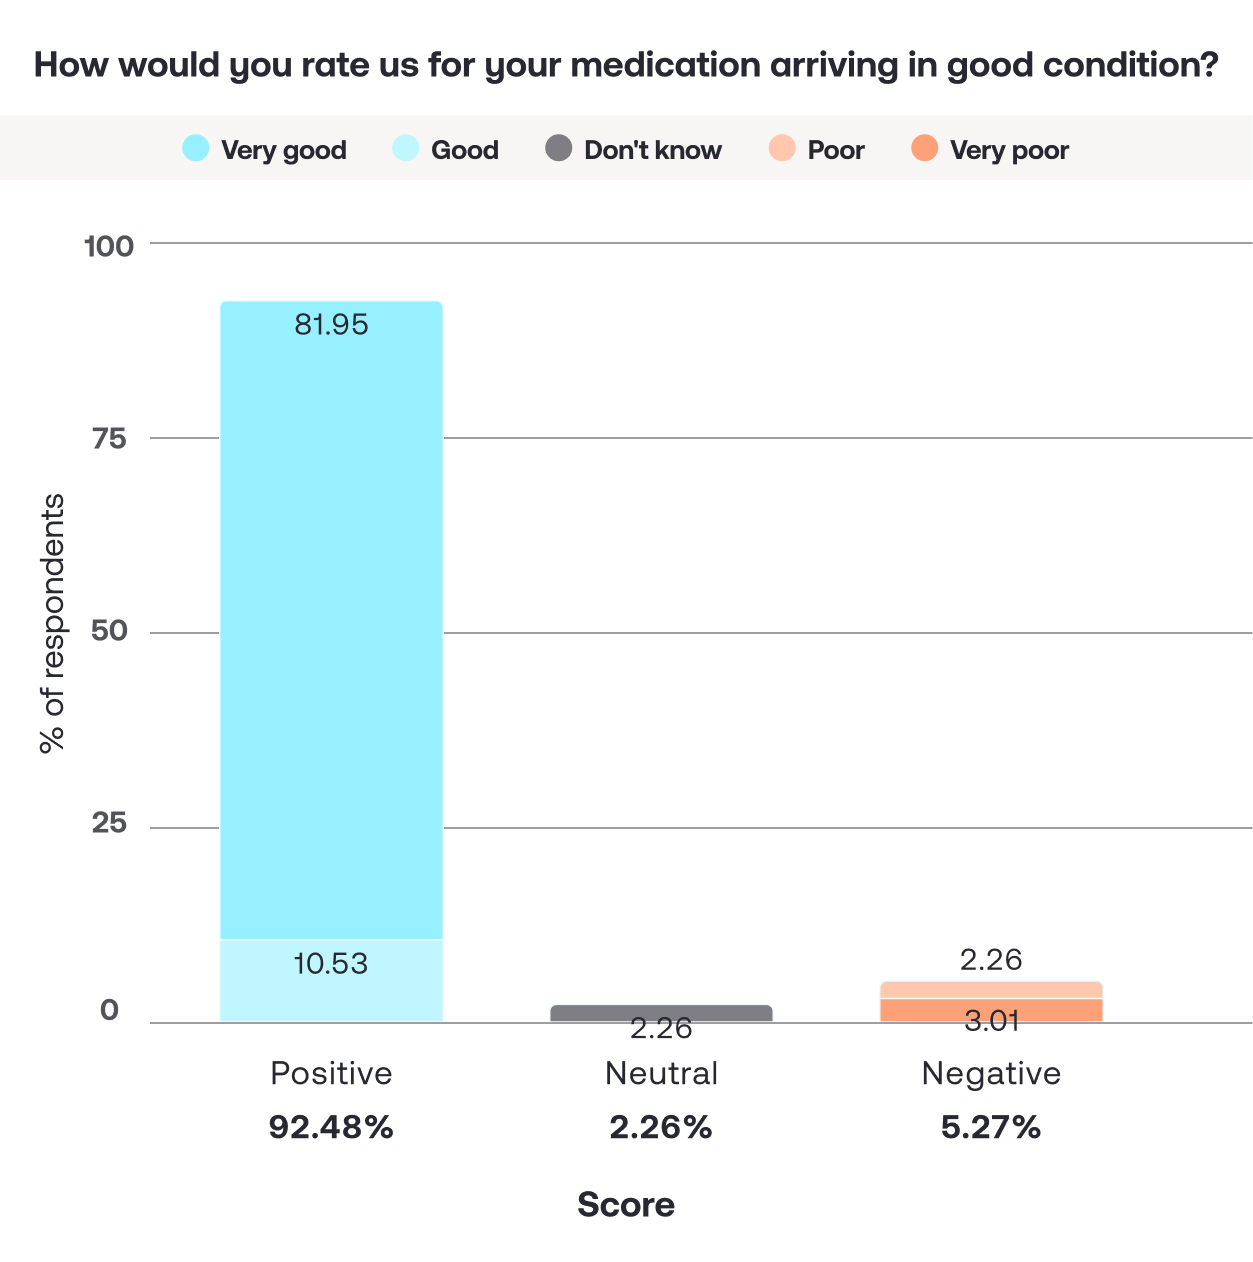
| Medication in good condition | 92.48% | 5.27% |
| Ease of getting treatment | 91.91% | 7.35% |
| Ease of paying for treatment | 91.91% | 3.68% |
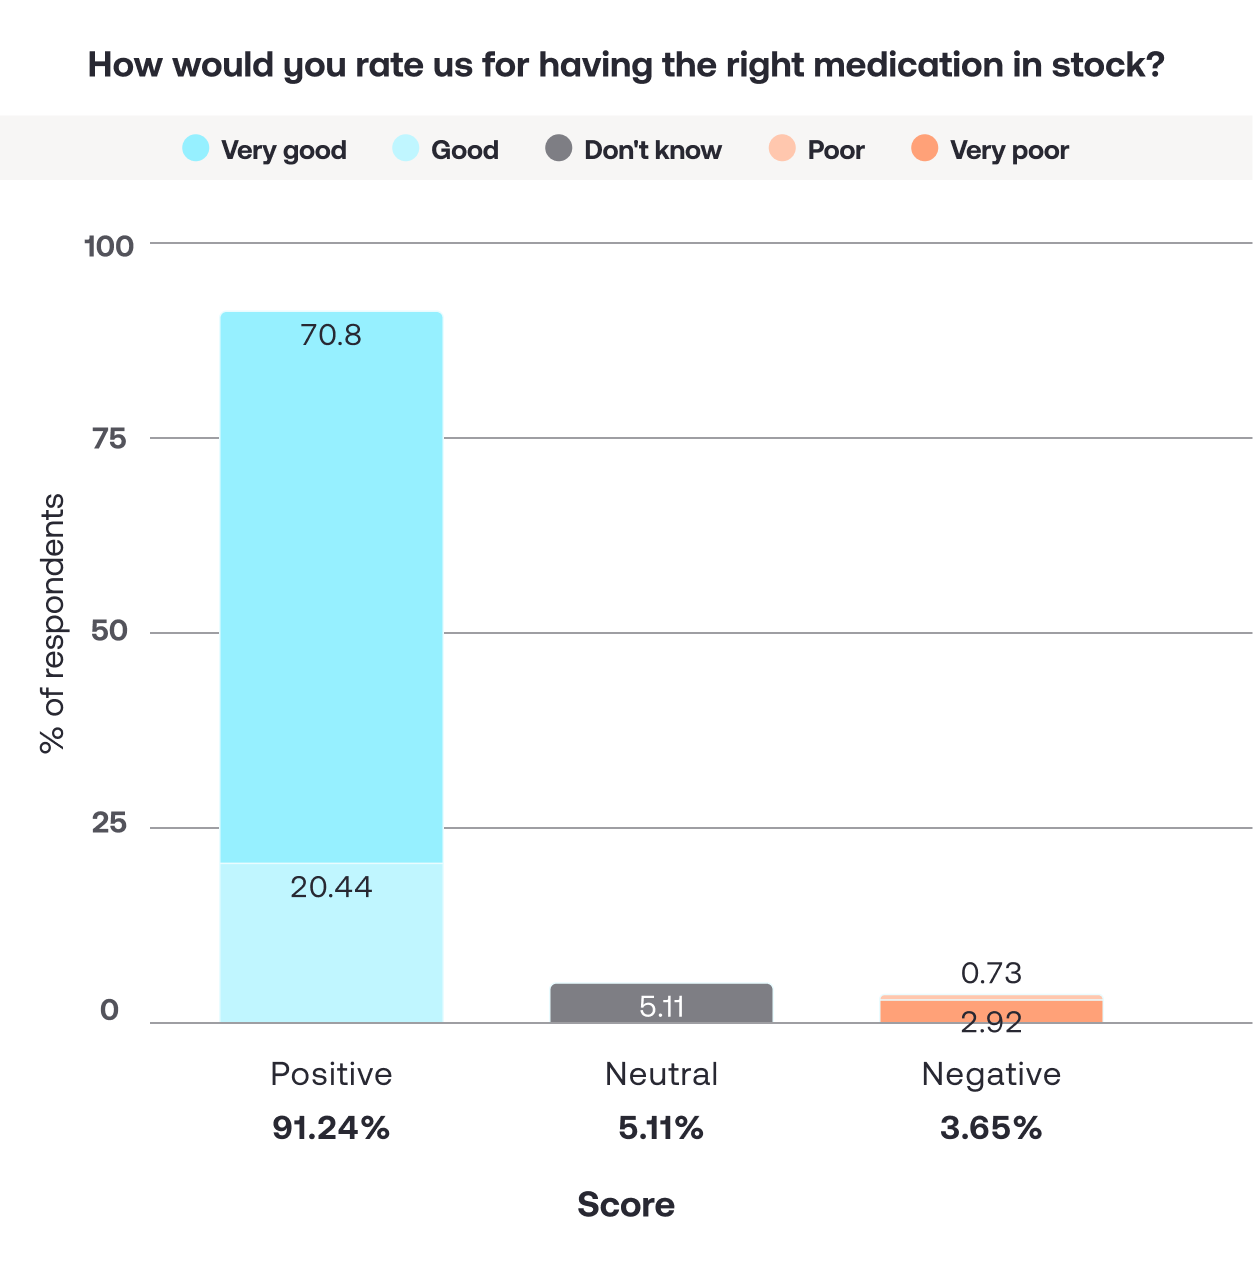
| Having the right medication in stock | 91.24% | 3.65% |
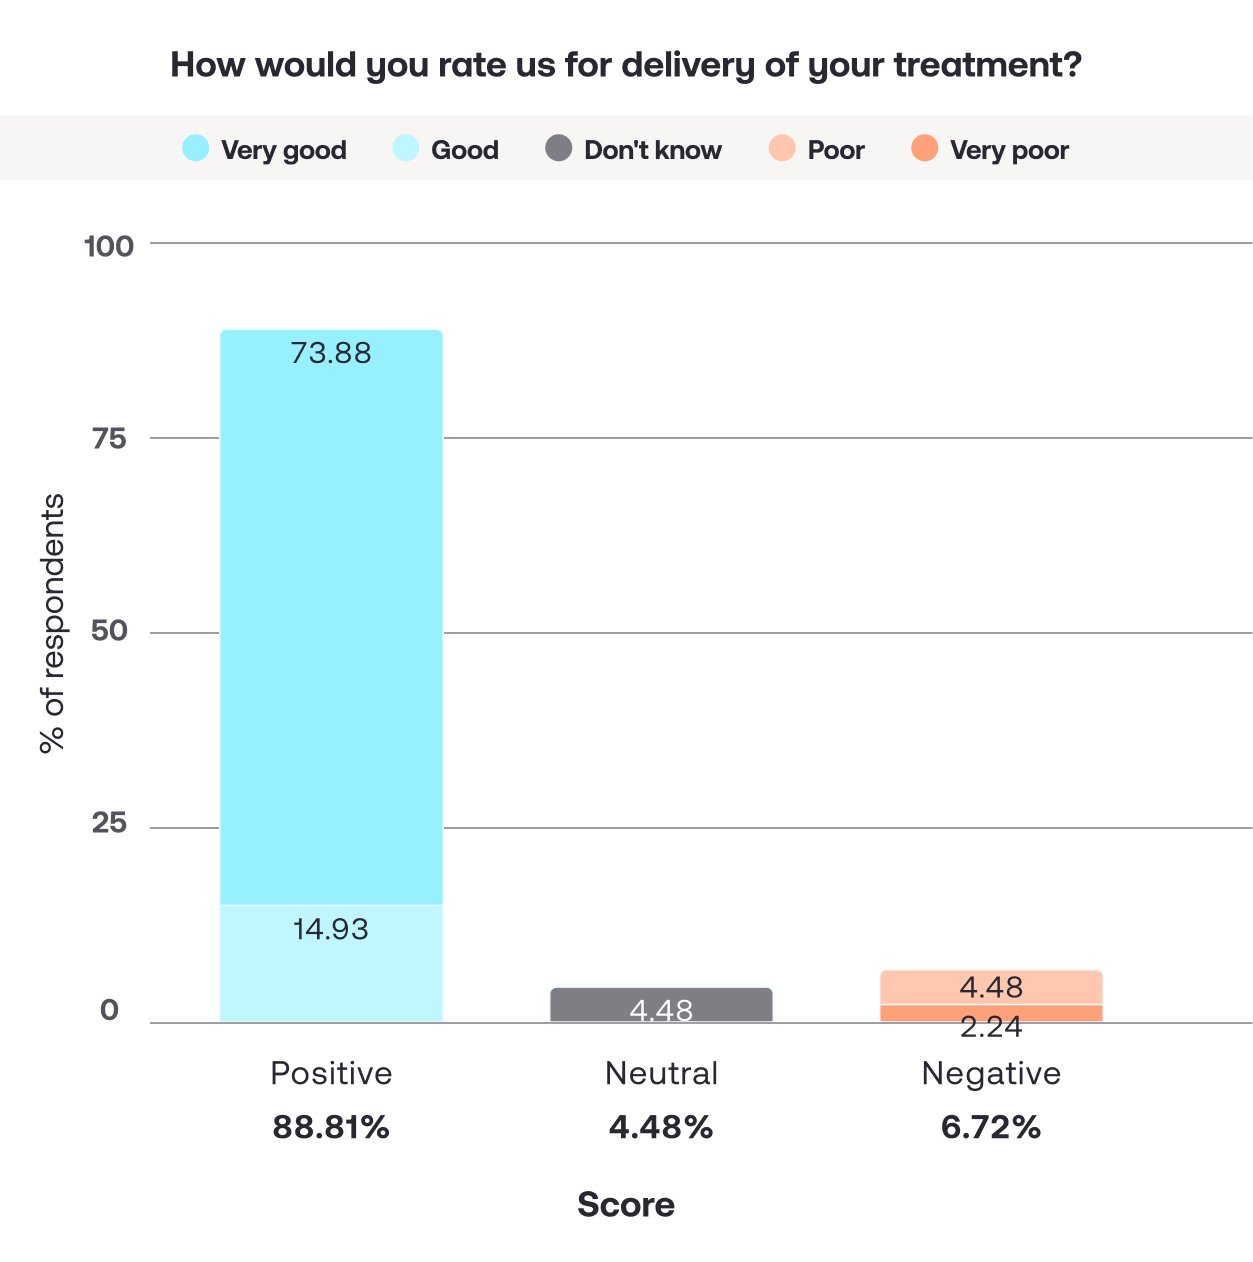
| Delivery of your treatment | 88.81% | 6.72% |
When asked: “Was the treatment you ordered effective?”
- 83.5% (111 respondents) stated the treatment was effective (“Yes”).
- 7.58% (10 respondents) stated the treatment was not effective (“No”).
- 9.09% (12 respondents) were “Not sure / Don’t know”.
While the percentage of respondents answering that their treatment was ineffective was small, we recognise that this still deserves attention.
As a result, here are our proposed actions:
- We’ll analyse our aftercare data.
We’ll review the responses we have for a significant representative sample of patients to identify any commonalities between medications or conditions where treatment was reported to be ineffective, then review our formulary and clinical processes to:
- investigate individual treatments that were often reported to be ineffective, and explore replacements;
- look for opportunities within our medical questionnaire to better identify treatments for patients that are more likely to be effective.
- We’ll review our aftercare processes.
We’ll interrogate our messaging to identify any gaps where additional coaching or support can make a difference to treatment efficacy. For example: Do we tell you when to expect results? Do we clarify expectations? Do we provide proper adherence guidelines? Do we explain how to measure success?
Another area of opportunity is treatment delivery.
Even though it still scored highly, this is the lowest-rated ‘transactional’ metric (88.81% positive). And it’s important to note that respondents were happy with the condition of the package (92.5% positive), but approval was lower for the delivery experience itself. This suggests the issue isn’t with our internal packaging but our third-party courier.
As a result:
- We’ll review processes together with our courier partner.
Some areas of focus may be delivery speed, communication, tracking, or the handling of the package during transit.
- We’ll investigate any potential reasons behind “Don’t know” (4.48%).
This is a comparatively high “Don’t know” percentage. It could imply that communication wasn’t transparent enough, so respondents genuinely didn’t know when to expect delivery, or that it’s an experience that leaves no impression.
Subscriptions
Here we asked your opinion on metrics like:
- “How easy it is to change your subscription”
- “It was clear to me that I was getting treatment on a subscription”
- “It was easy to pause my treatment.”
And the data seemed to reveal that a large portion of respondents who were subscribed have either not tried, or didn’t know how to, manage their subscription.
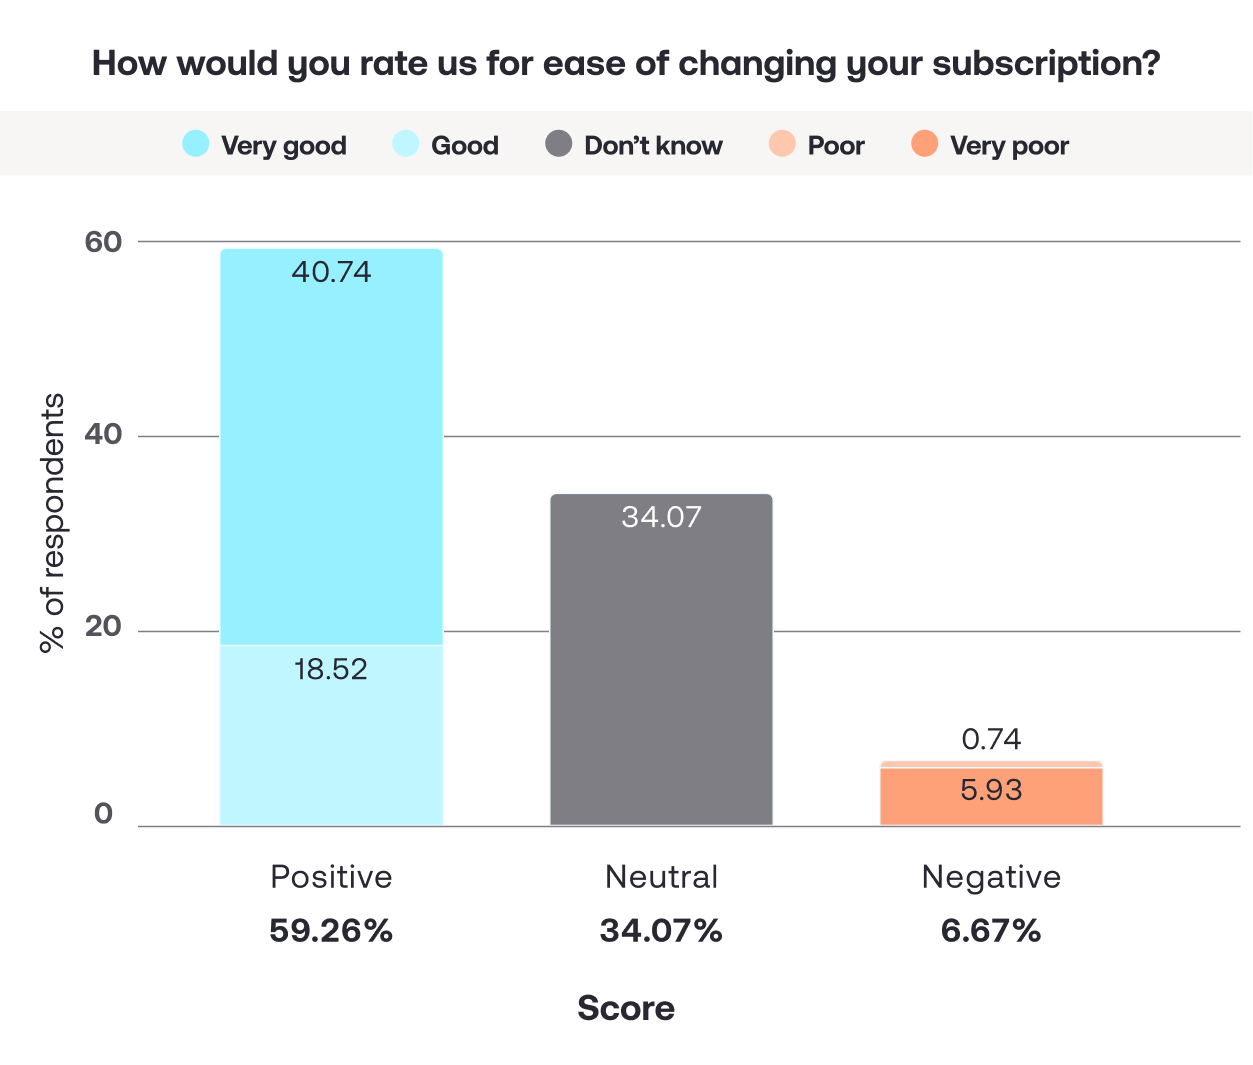
The largest insight is that 34% of respondents “Don’t know” how to change their subscription, and 21% were “Neutral” on how to pause it.
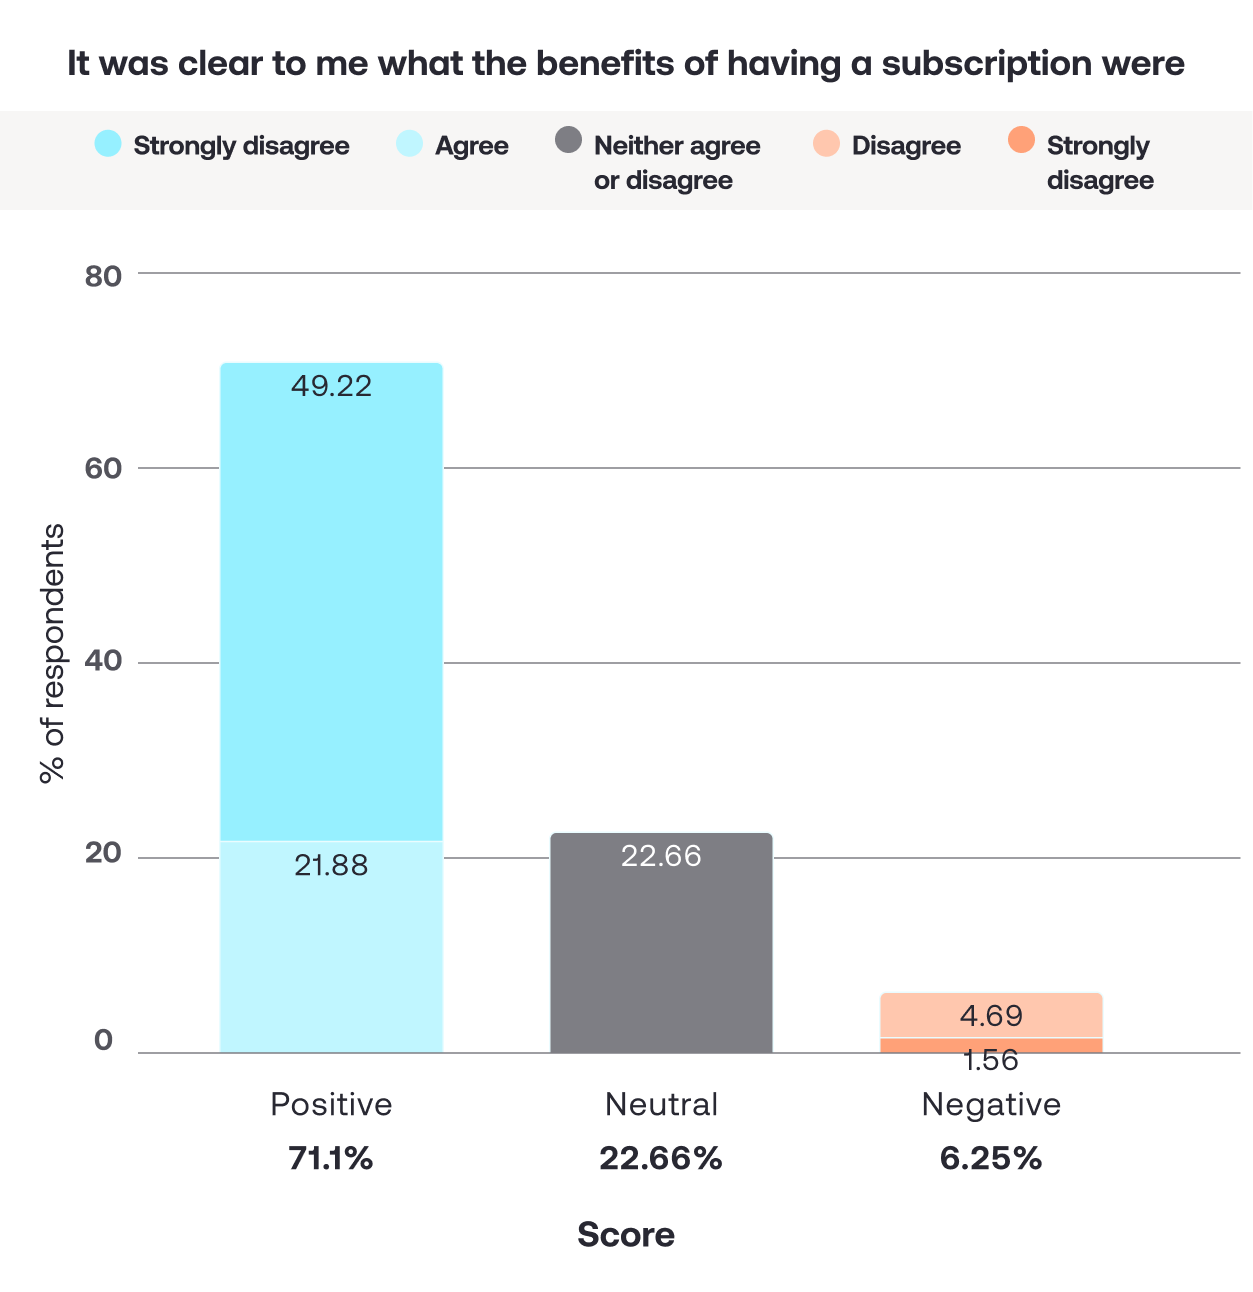
And while our overall communication is strong, our self-service tools seemed to be an issue for some respondents, and the value of being on a subscription wasn’t clear to almost 30% of respondents.
Here’s a summary of subscription experience:
| Metric | Positive (Agree/Good) | Negative (Disagree/Poor) | Neutral (Neither/Don’t know) |
|---|---|---|---|
| Ease of changing subscription | 59.26% | 6.67% | 34.07% |
| Clarity of subscription benefits | 71.10% | 6.25% | 22.66% |
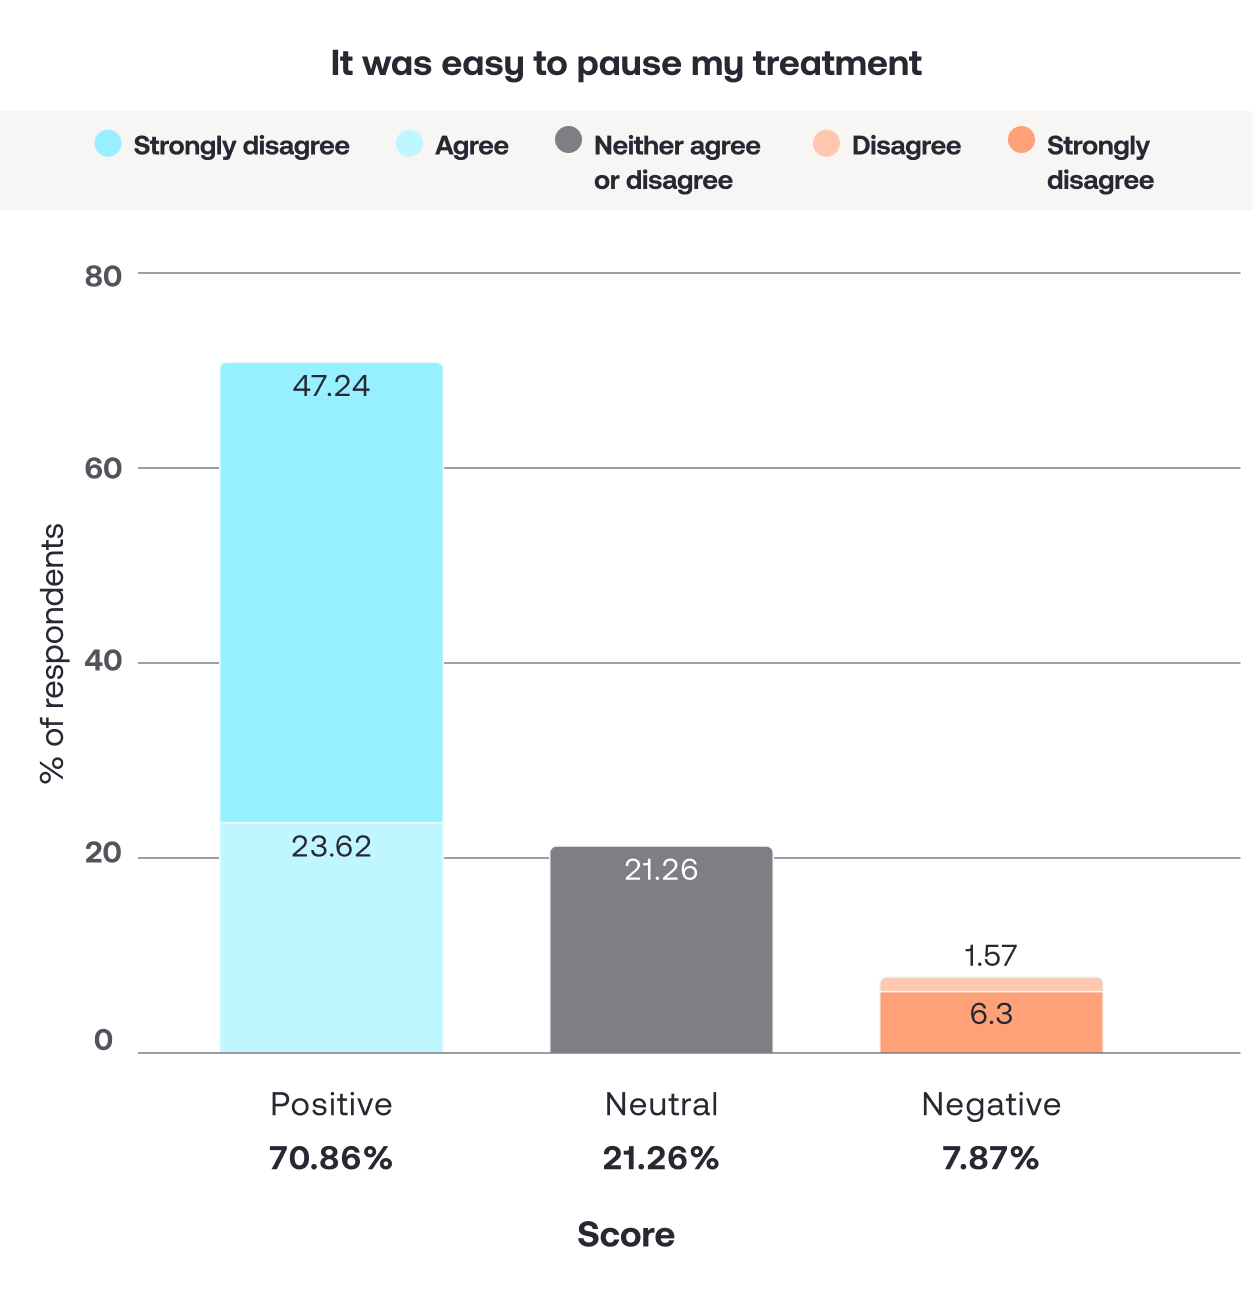
| Ease of pausing treatment | 70.86% | 7.87% | 21.26% |
| Delivery reminders | 80.47% | 6.25% | 13.28% |
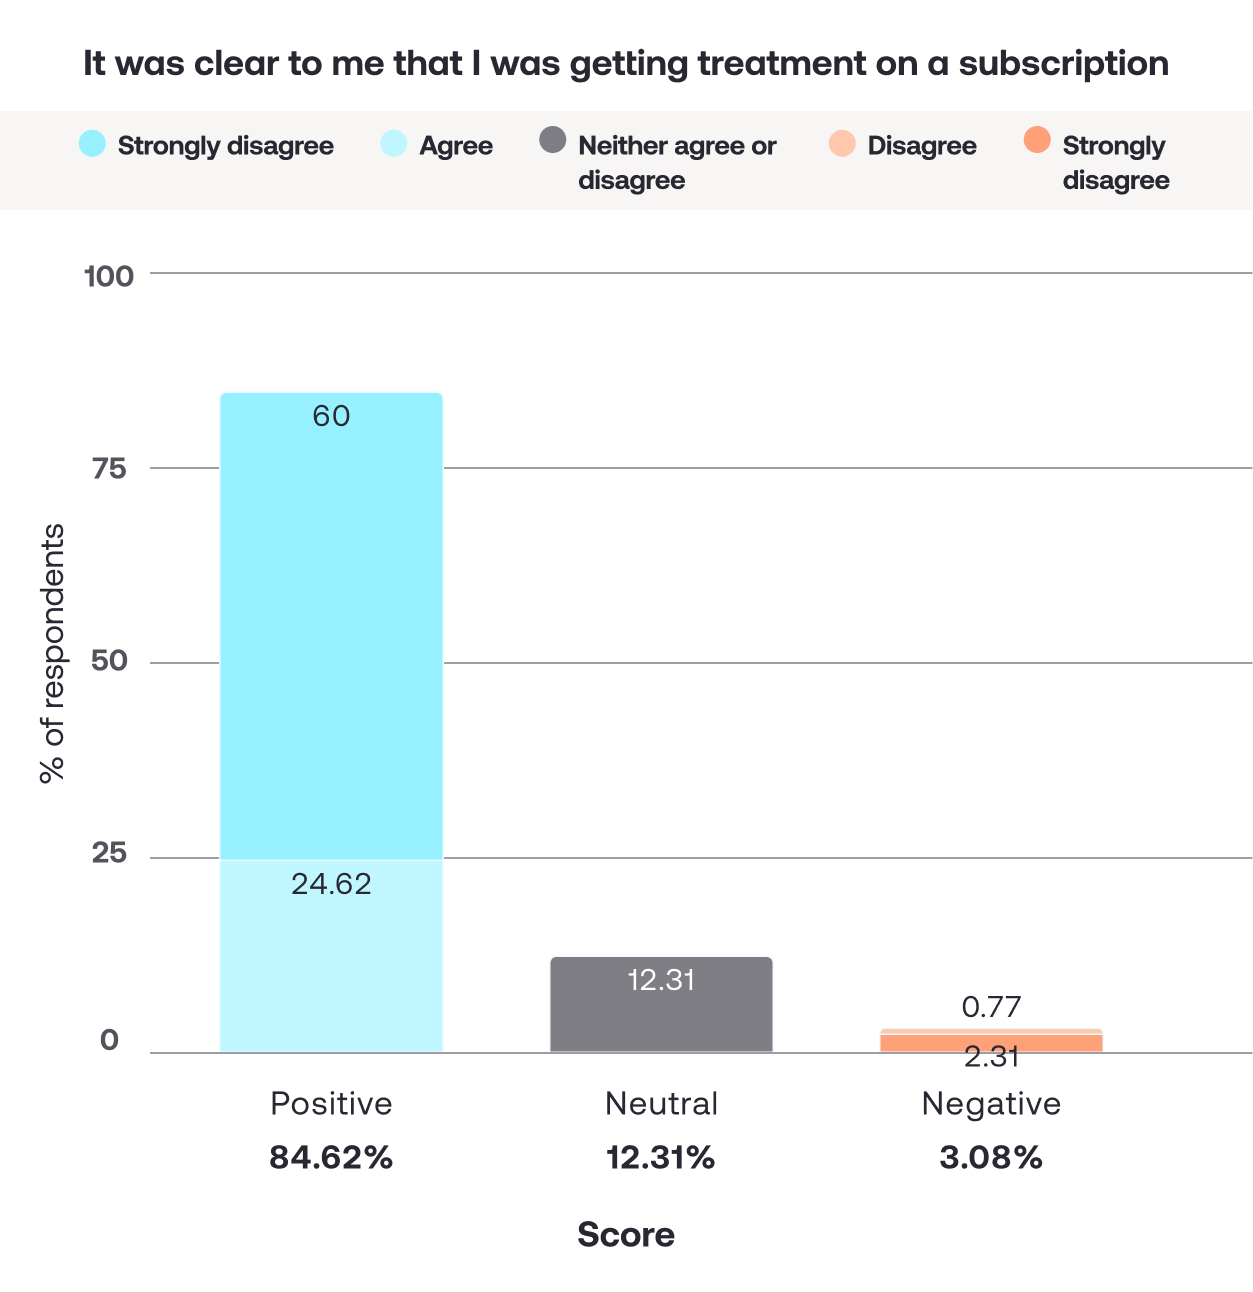
| Clarity of subscription at signup | 84.62% | 3.08% | 12.31% |
This could imply that a significant number of respondents had never interacted with their subscription settings.
We are currently developing an upgrade to the subscription management processes within patient accounts. But in the meantime, we will review our content to make sure our existing features are clear and understandable. The goal is to help those patients who don’t know how to edit their subscriptions, so that whenever they may need to, they can do so with confidence.
We’ll also review patient account areas, making sure that options to pause, change, or see history are given enough clear prominence.
Overall our subscription flexibility features seemed to be met with approval:
- 59% of respondents agreed that changing their subscription was easy;
- 71% of respondents agreed that pausing their treatment was easy.
But there were a minority of negative responses to these questions too:
- “Ease of pausing” had a negative score of 7.87% (10 patients), with 8 patients “Strongly” disagreeing.
- “Ease of changing” had 9 negative responses, with 8 of them being “Very poor”.
This may indicate that a small percentage of patients are having trouble navigating the self-service tools within their account.
As a result, we’ll conduct an internal audit of this user experience, and try to identify if and where we can make this journey simpler.
And lastly, it was clear to 84.6% of respondents that they were entering into a subscription at sign-up, but the benefits of a subscription weren’t clear to 29% of them (either neutral or disagree).
As a result, we’ll ensure we’re clearly stating the value of the subscription wherever possible.
We’ll review our content to ensure that reminder emails, the account homepage, and other areas list the benefits of a subscription, such as:
- Never running out of treatment.
- Hassle-free appointments.
- No pharmacy collections.
- Savings on treatment price.
- Referral discounts
- Access to our clinical team.
Our team
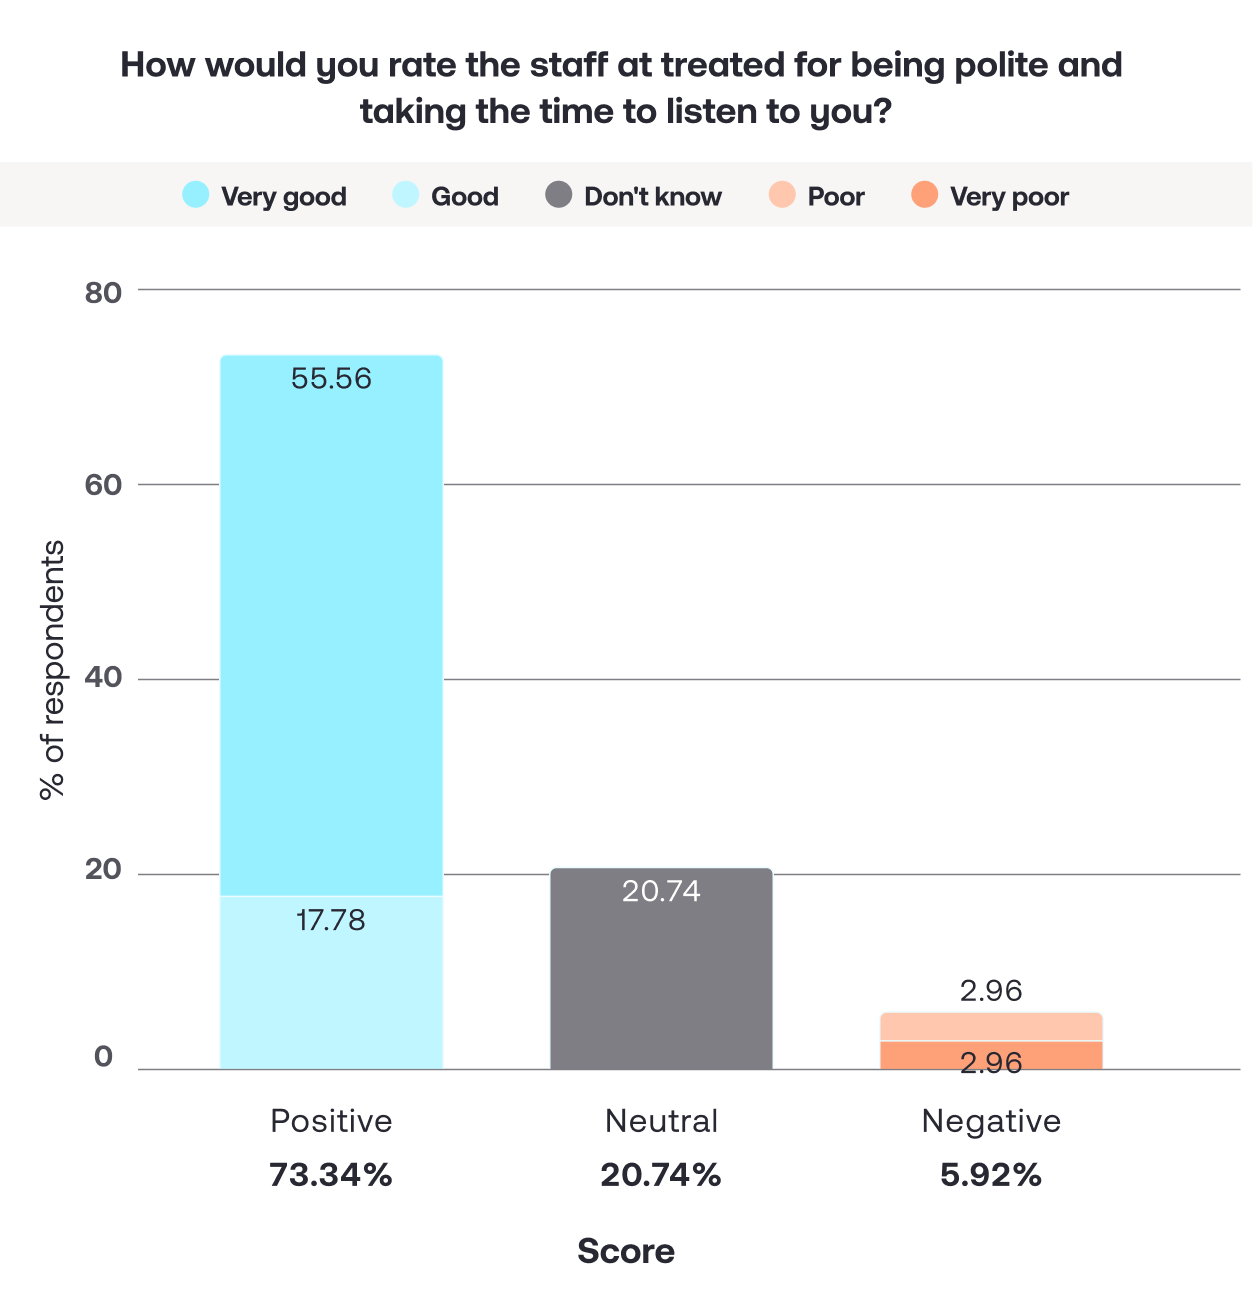
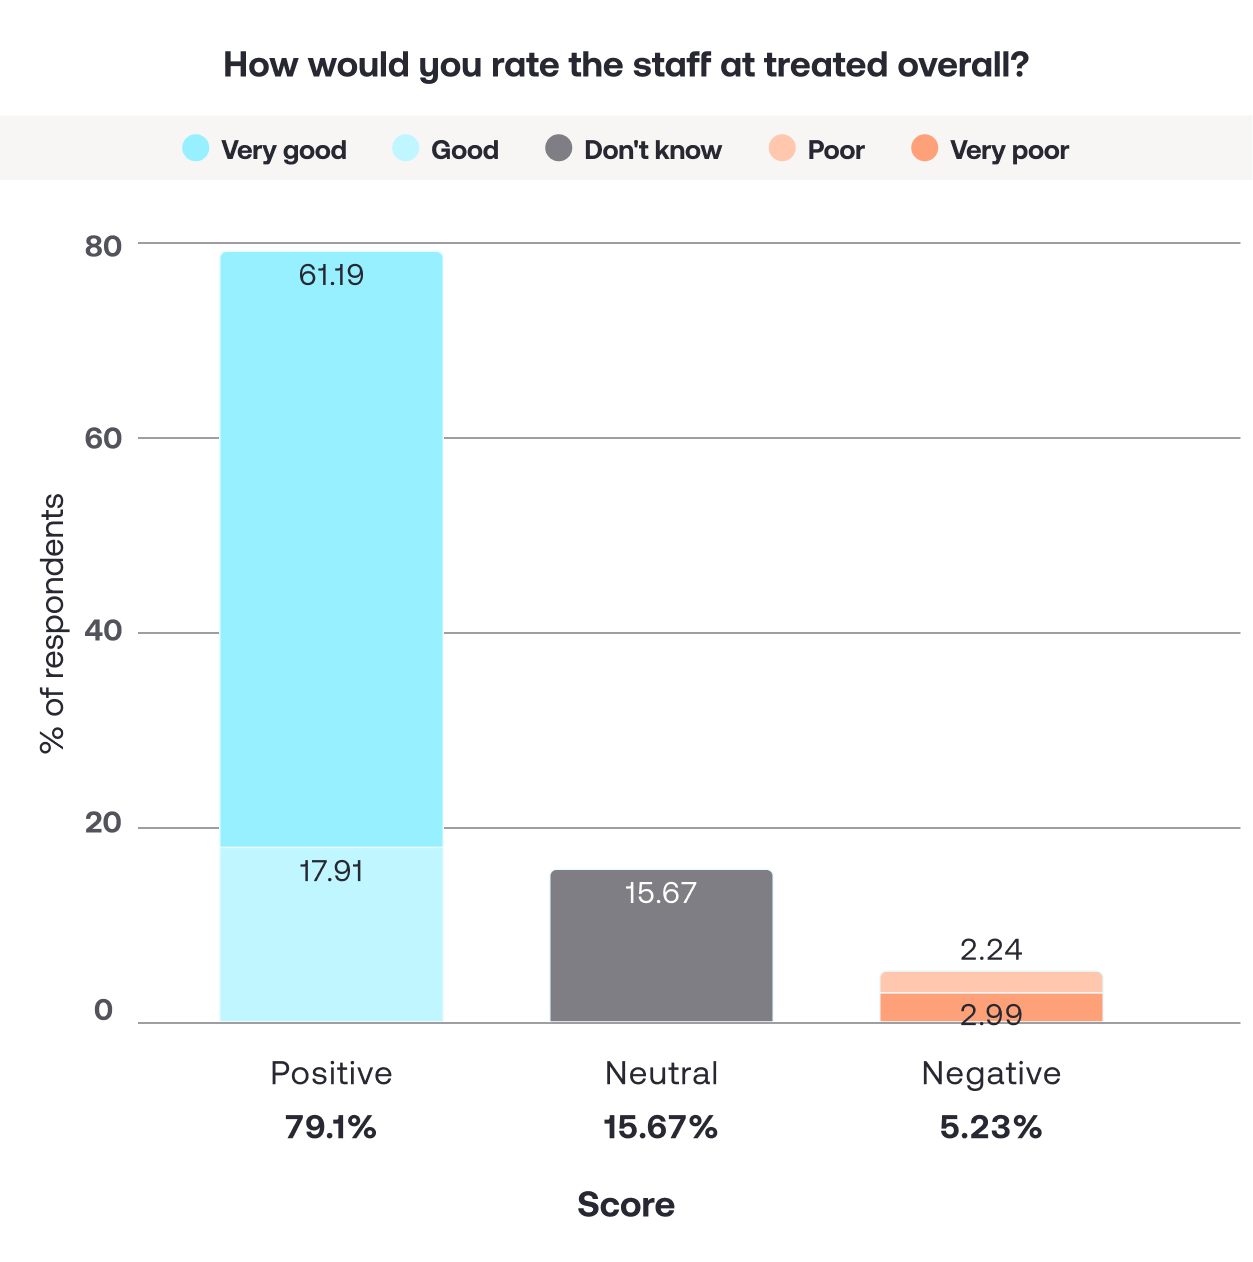
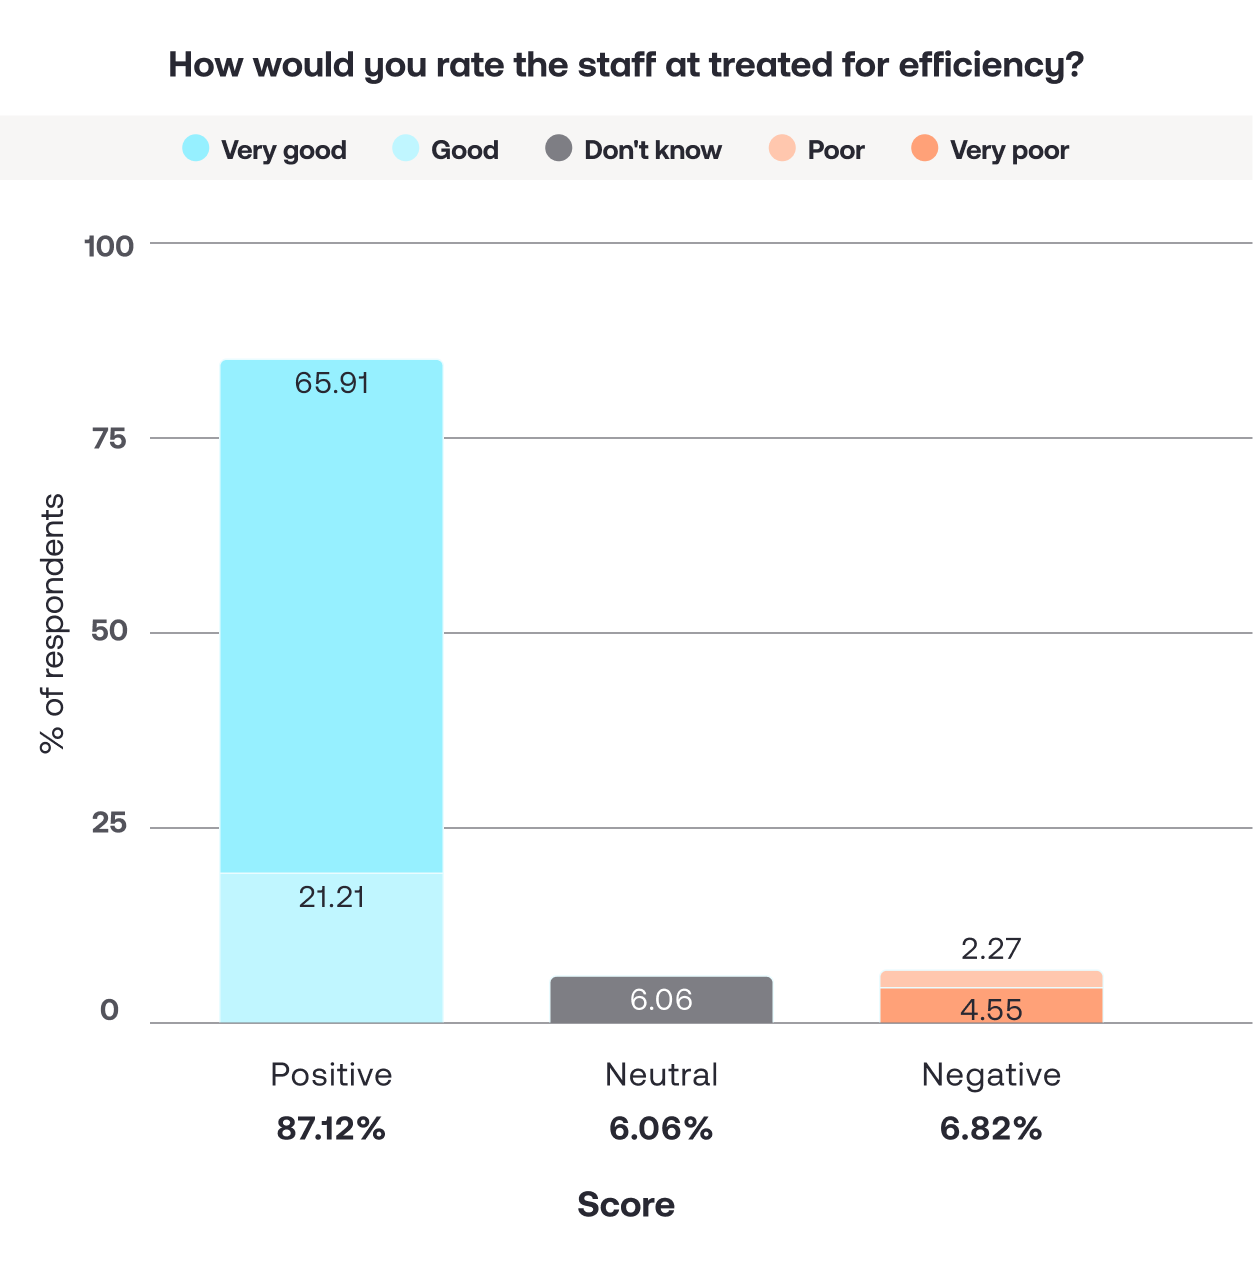
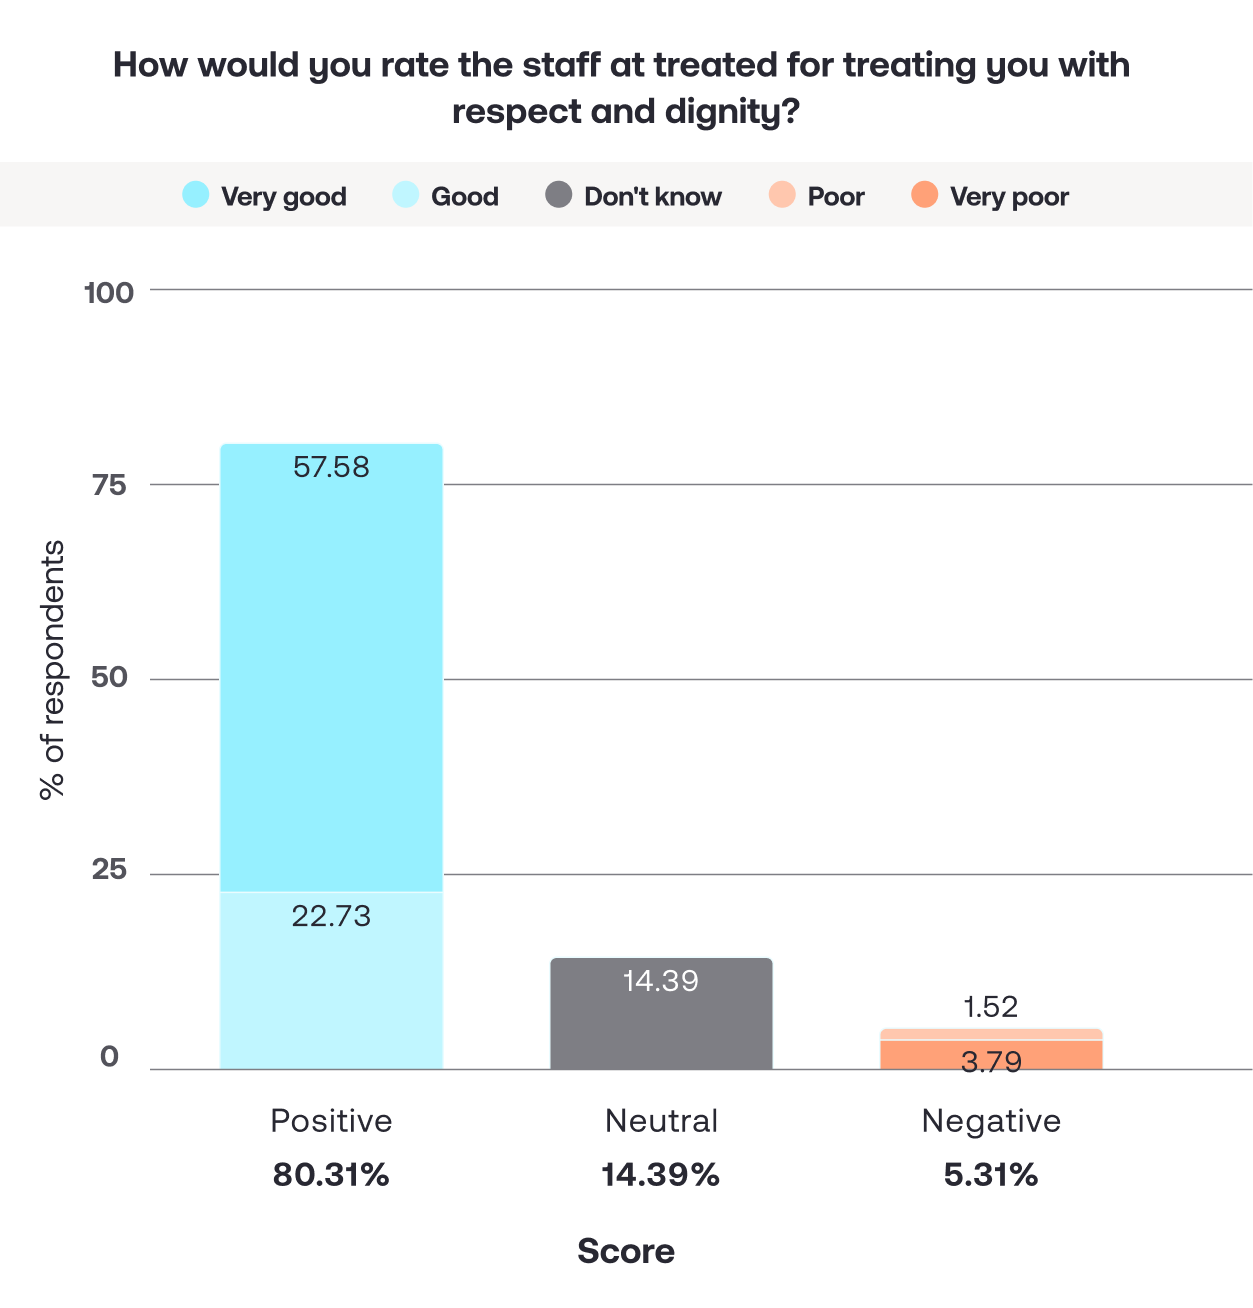
For the majority of respondents who interacted with our team, the experience was excellent. Our staff are rated as efficient (87.1% positive), polite (73.3% positive), and respectful (80.3% positive).
There were also a significant number of respondents who answered “Don’t know” when asked to rate us on these metrics. 28% had never needed to contact customer care, and 18.5% had never needed to contact a clinician. This may suggest the journey was efficient enough for these respondents not to require support.
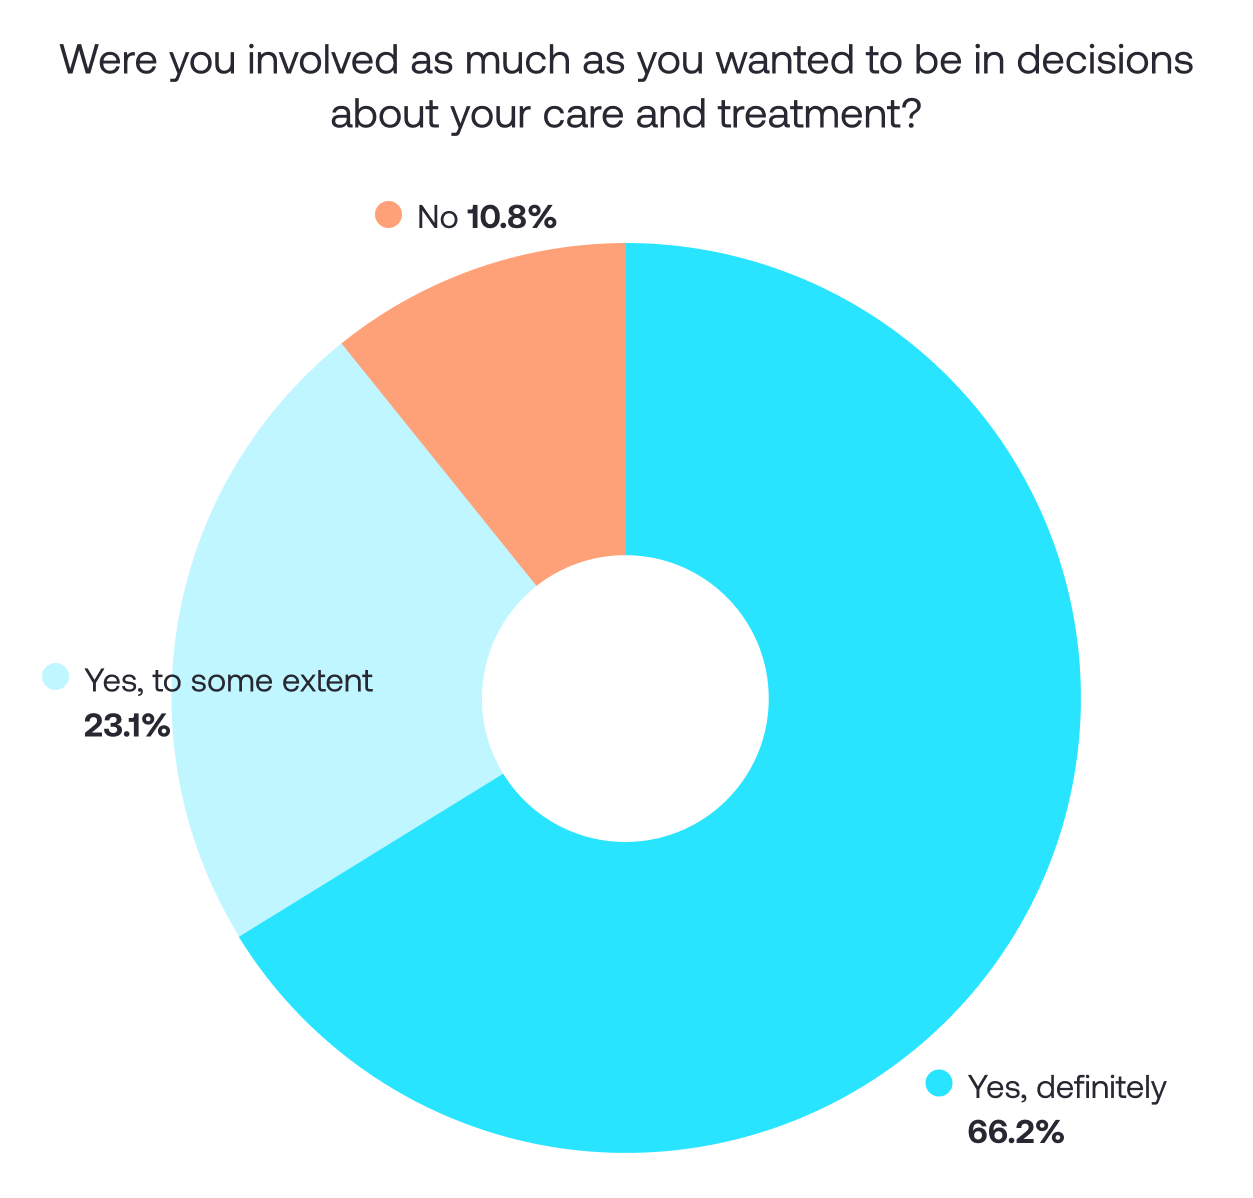
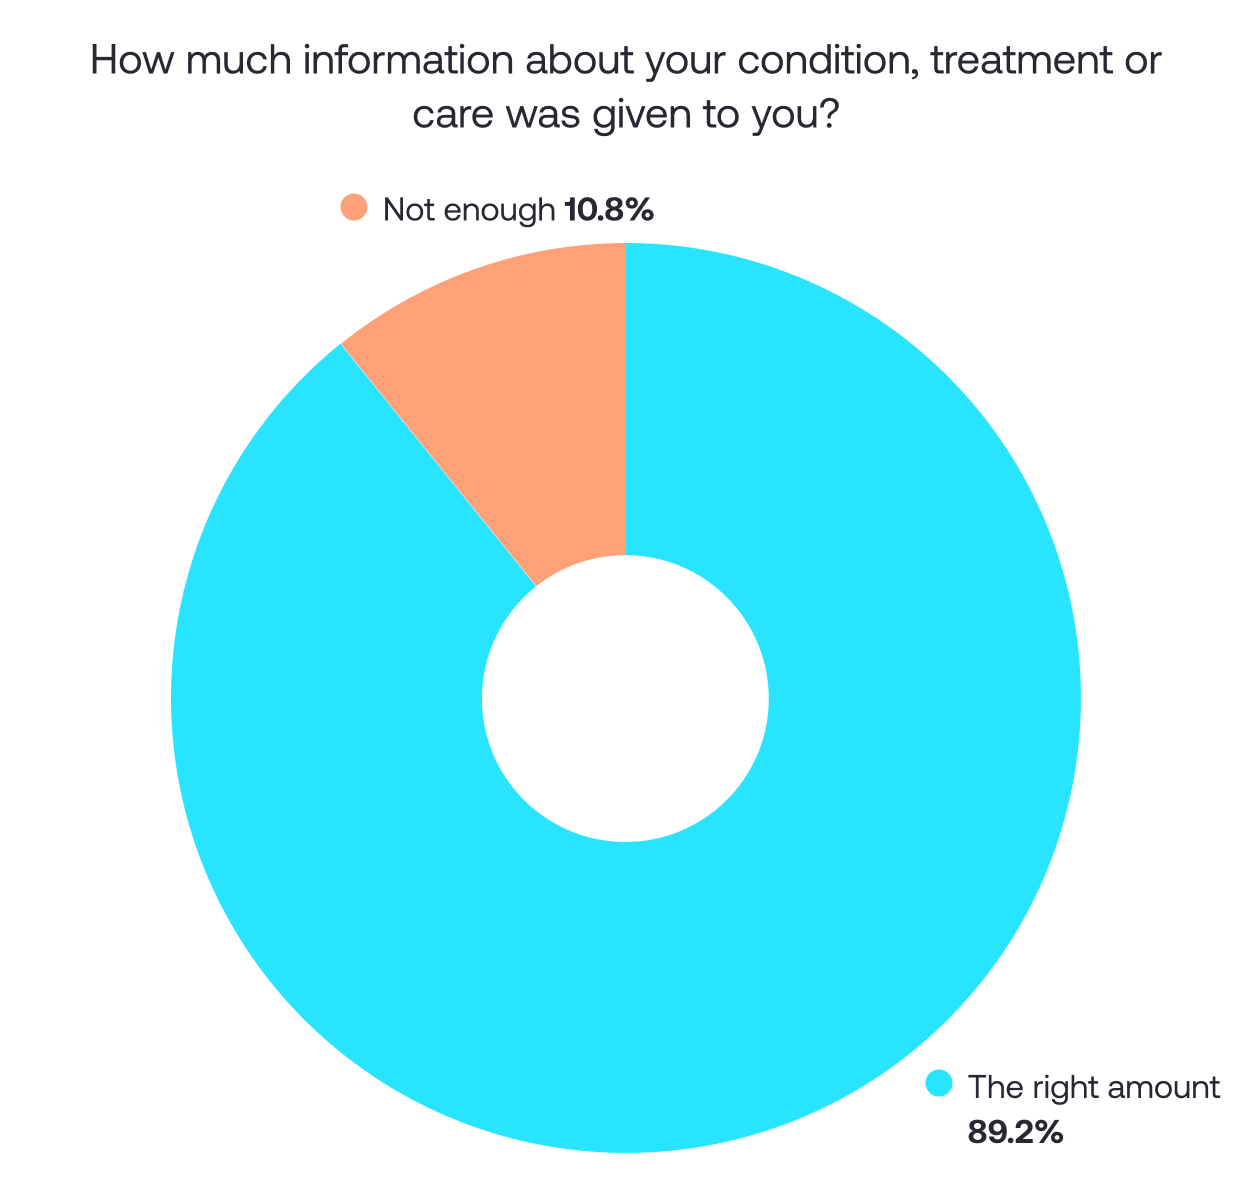
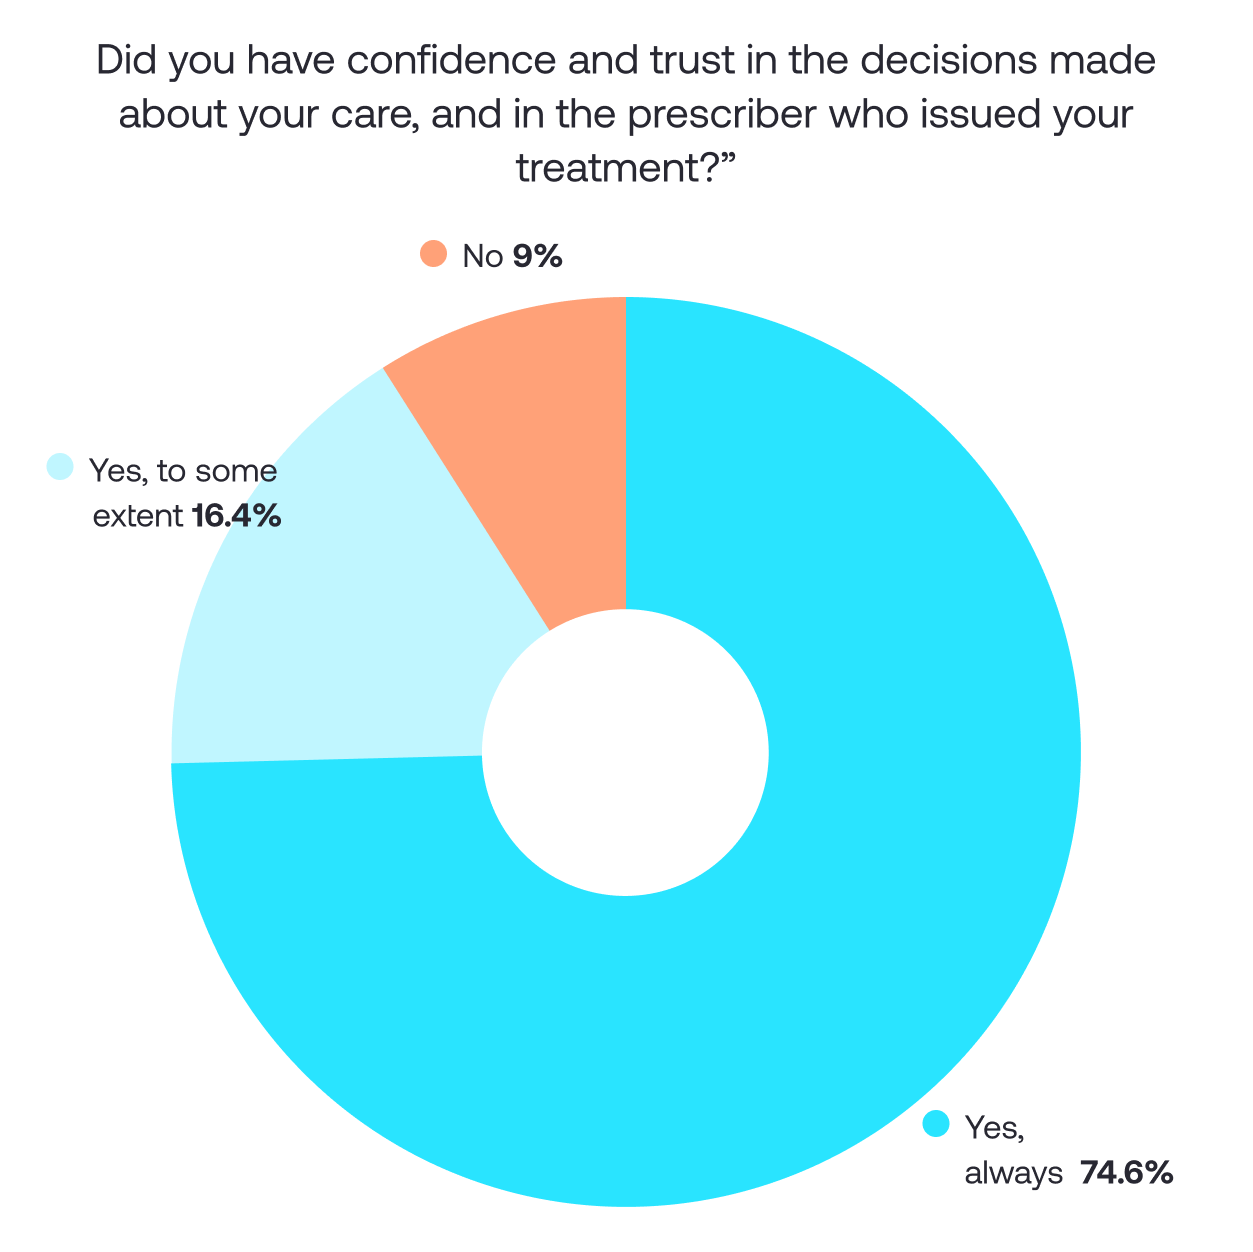
However, a minority of respondents (around 10-11%) had a poor experience, feeling uninvolved in their care (10.8% “No”), lacking trust in their prescriber (9% “No”), and not getting enough information (10.8% “Not enough”).
Here’s a summary of the staff & care experience:
| Metric | Positive (Yes/Good/VG) | Negative (No/Poor/VP) | Neutral / Don’t know |
|---|---|---|---|
| Trust in prescriber | 91.05% | 8.96% | 0.00% |
| Involvement in care | 89.23% | 10.77% | 0.00% |
| Information given | 89.23% | 10.77% | 0.00% |
| Staff: efficiency | 87.12% | 6.82% | 6.06% |
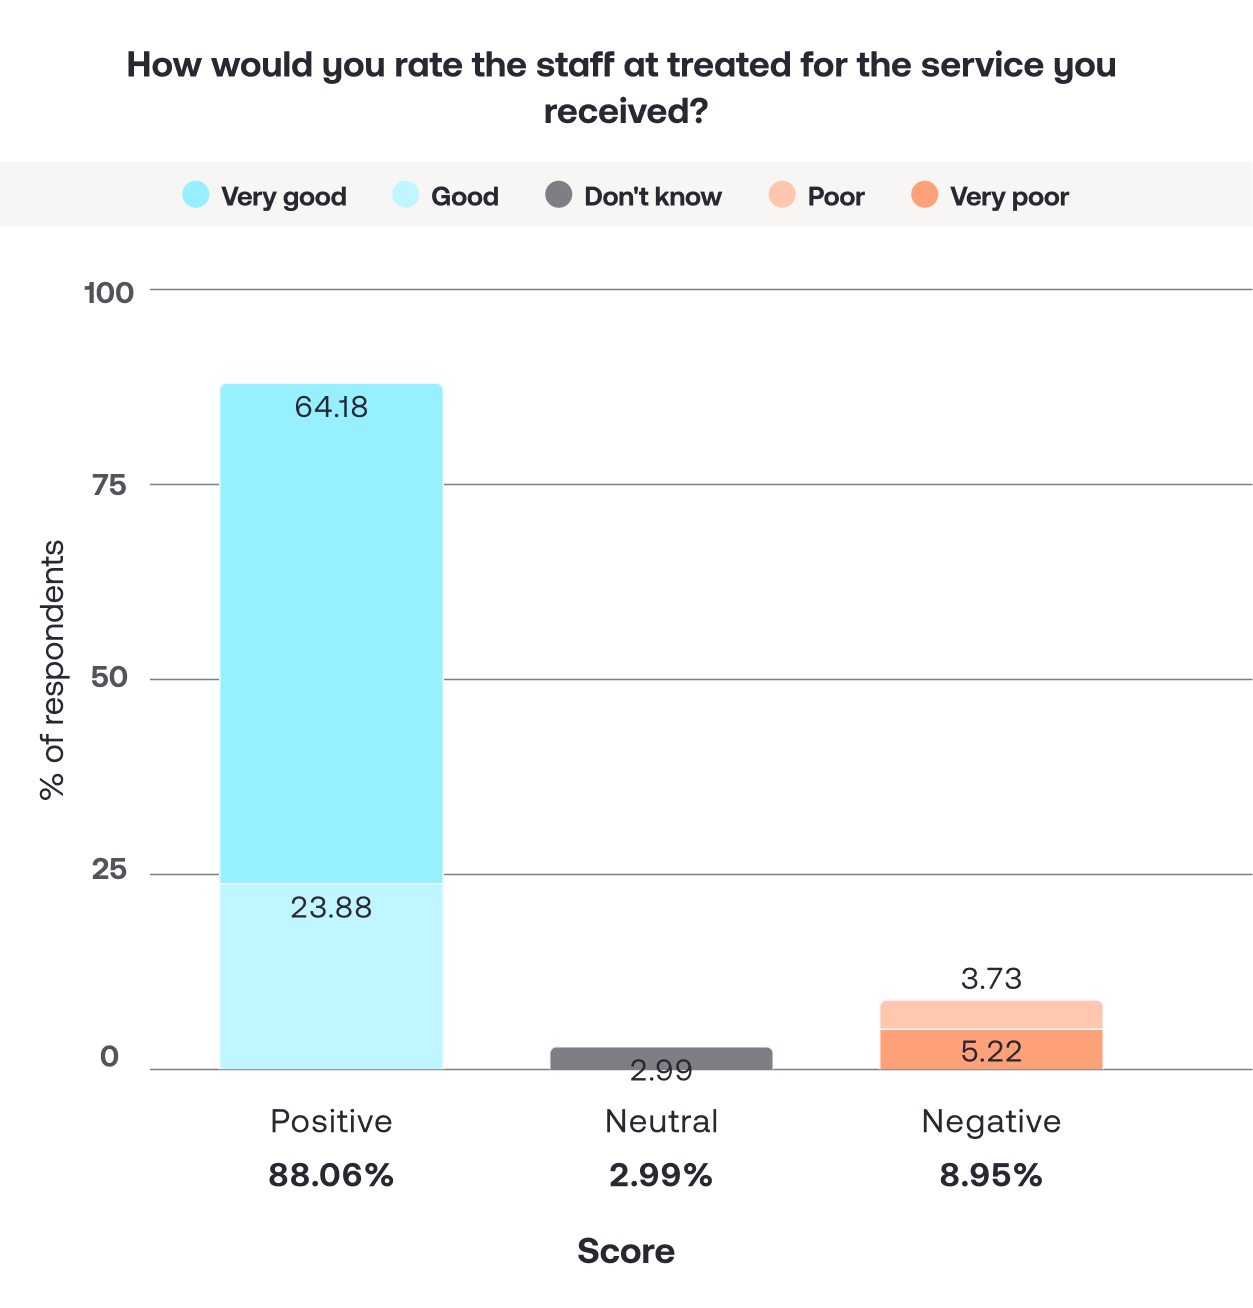
| Overall service | 88.06% | 8.95% | 2.99% |
| Staff: respect & dignity | 80.31% | 5.31% | 14.39% |
| Contacting clinicians | 74.81% | 6.67% | 18.25% |
| Staff: politeness/listening | 73.34% | 5.92% | 20.74% |
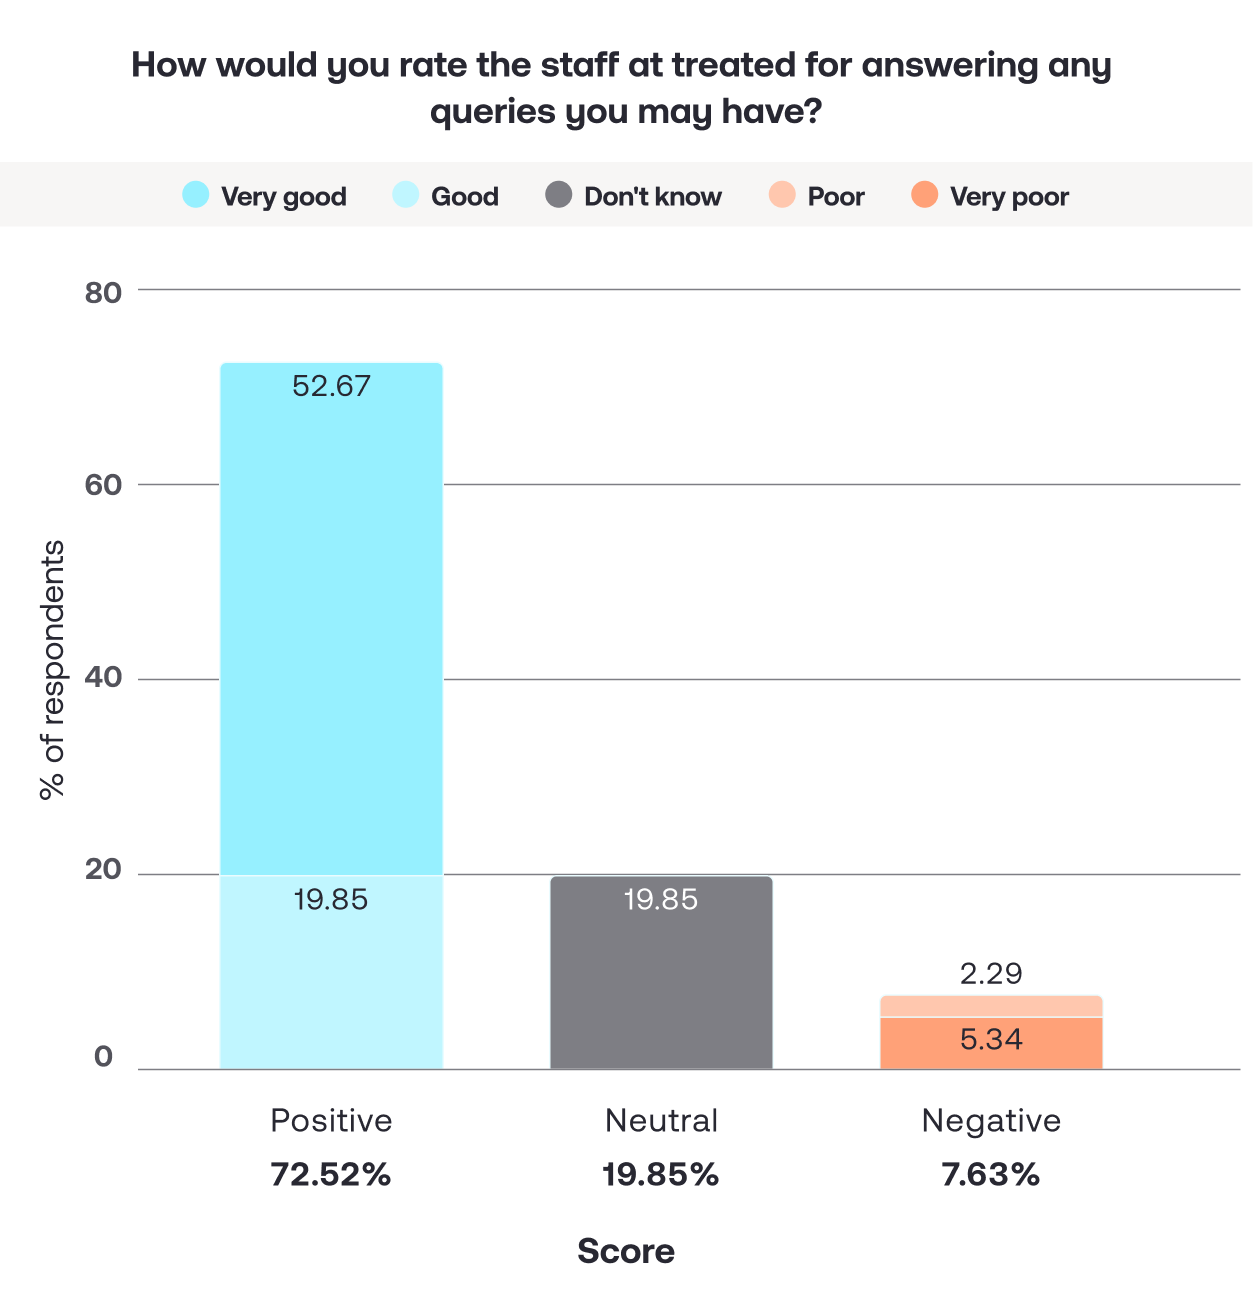
| Staff: answering queries | 72.52% | 7.63% | 19.85% |
| Contacting customer care | 64.45% | 7.40% | 28.15% |
While encouraging overall, these findings suggest that there could be room for improvement in one or two areas. But there are some important caveats that may be relevant to these ratings.
Although we make every attempt to involve patients in decisions about their care, the decision about whether to prescribe treatment must ultimately be the clinician’s.
In cases where a patient disagrees or is dissatisfied with the clinician’s advice or recommendation, the clinician cannot put the patient’s health at risk by advising against their qualified judgment, and that of the wider clinical team.
And as an online service, our clinical range can occasionally be more limited than in-person services. So there may be cases in which, even if a patient has accessed a specific treatment before through their GP or primary care provider, we can’t supply treatment without a more detailed examination or testing that cannot be performed through our platform. In these cases, we always try to signpost patients to the relevant in-person service for further guidance.
But we acknowledge that there may be cases where respondents had a poor experience but the above didn’t apply. To address this, we’ll:
- continue to regularly review our clinical processes, to see if there are conditions where we can support improved shared decision-making.
- continue to regularly review our declined prescription processes, to ensure that patients are receiving as detailed an explanation as possible when a decision is made on safety or suitability grounds to not offer them treatment.
- review our aftercare messaging to ensure it’s as comprehensive and accessible as possible, and provides clear information on what to expect from treatment.
Another finding is that “Answering any queries” had a combined negative rating of 7.63% (10 patients) of all staff interactions, followed by “Contacting our customer care team” (7.4% negative) and “Contacting our clinicians” (6.7% negative).
We always try to ensure we’re solving problems on the first try as often as possible. But the 7.6% of respondents who had a negative experience related to “answering queries” could suggest that a minority of patients may not be receiving a response that sufficiently answers their question, or not receiving a response in a timely fashion.
Our staff were rated as polite (73.3% positive), respectful (80.3% positive), and efficient (87.1% positive). This may indicate that in scenarios where respondents encountered issues, it was more to do with process than people. To address this, we’ll:
- analyse our average response time for messages, and identify ways to improve this if required, by: reviewing peak-time staffing; and seeking to channel queries more efficiently where possible, so that specific categories of queries reach the person best-placed to answer them.
- analyse a significantly-sized representative sample of patient-to-service and patient-to-clinician interactions, review whether any posed queries were satisfactorily resolved, and use this information to identify areas for training and improvement.
- consider the implementation of a response-rating feature, that enables users to score and give immediate feedback on the service interaction they just had.
Proactive health advice
Here we asked how we did at giving advice on topics like current health problems, living a healthy lifestyle, and disposing of medicines.
The core insight is that, for those patients who do use our advice, the quality of it is high (95%+ positive). This is a powerful, high-trust interaction that we’ll continue to develop.
However, the “Never used” rate (40-70%) indicates that many respondents either didn’t know these services existed, or didn’t view us as a source for this kind of advice.
This may be somewhat supported by the high “no” response rate to the question: ‘Have we ever given you advice about any of the following?’
- For ‘Stop smoking’ 96.2% said ‘No’
- For ‘Healthy eating’ 82.7% said ‘No’
- For ‘Physical exercise’ 85.7% said ‘No’
That said, advice on the above may not have been relevant to the treatment being requested by the patient, so it wasn’t specifically offered. The survey questions we asked are also modelled on those used by NHS GP surgeries, who provide this advice in the community as part of their broader public health remit. That said, there may be an opportunity for us to offer this advice more widely to all people accessing treatment, and not just primarily to those accessing smoking cessation and weight management treatment.
Analysis of our advice
| Metric | % “Never used” | Total users left | Positive (Well + VW) (of users) | (Negative (Not at all) (of users) |
|---|---|---|---|---|
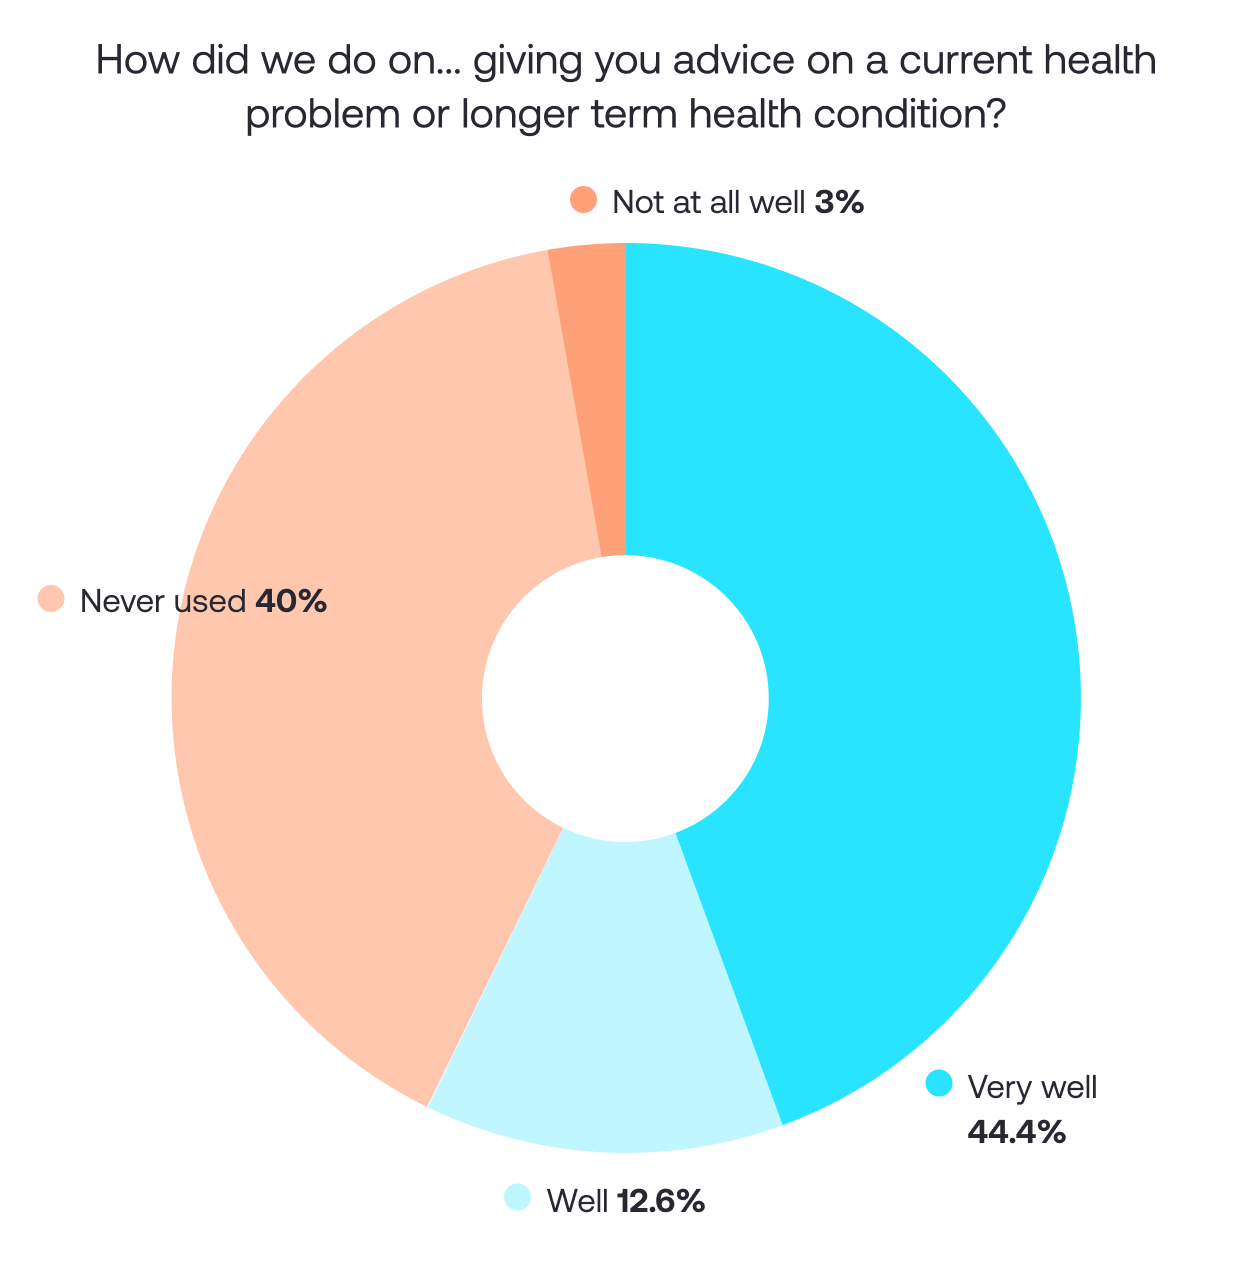
| Giving advice on a current health problem | 40.00% | 81 | 95.1% (77/81) | 4.9% (4/81) |
| Giving general advice on a healthy lifestyle | 54.89% | 60 | 96.7% (58/60) | 3.3% (2/60) |
| Disposing of medicines | 68.94% | 41 | 95.1% (39/41) | 4.9% (2/41) |
| Giving advice on health services elsewhere | 64.89% | 46 | 89.1% (41/46) | 10.9% (5/46) |
These results could suggest that our advisory services would benefit more patients if they were given more prominence. For people who find it, our advice performs at a 95%+ satisfaction rate. “Healthy lifestyle advice” (96.7% positive) and “health condition advice” (95.1% positive) are two of our highest-performing offers, yet they were used by less than half of respondents.
Here are our actions:
- Market our expertise. We’ll more proactively advertise our knowledge.
- Review our communication both on-site and via email to emphasise that treatment plans come with free, expert advice, and the ability to ask our clinicians about anything, any time.
- Review our current processes to ensure that persons who tell us that they have a lifestyle factor or health condition during a consultation that would benefit from advice related to smoking, diet or physical activity, are offered the relevant advice.
- Review our aftercare material for metabolic conditions such as diabetes or high blood pressure, to ensure that healthy lifestyle advice is offered.
- Review where we can add signposting links to other health organisations that may be able to offer care that falls outside of our scope, so that patients can access more specialist support if required.
Overall satisfaction
Here, we asked two questions:
- “Taking everything into account – the staff and the service provided – how would you rate Treated?”
- “How likely would you be to recommend us to a friend or family member?”
Overall, the results indicated that we provide a high-performing and well-regarded service, with 88.6% of respondents rating us as “Good” or “Very good”, and 83.7% saying they would be ‘Likely’ or ‘Very likely’ to recommend us to a friend.
But we recognise the 9.1% who rated our service as ‘Poor’ or ‘Very poor’ and the 11.8% that said they would be ‘Unlikely’ or ‘Not at all likely’ to recommend us to a friend, and these opinions shouldn’t be ignored.
As explained above, the areas for focus seem to be:
- a small percentage of respondents not feeling involved in their care, having trust in their prescriber, or receiving enough information;
- a smaller percentage of respondents experienced difficulty reaching our team or having a query resolved.
To address this, we’ll:
- continue to regularly review our clinical processes, ensuring they support shared decision-making as much as possible and give clear explanations where prescriptions are declined;
- review the response-time and quality of a significant subset of our patient interactions to identify areas where communication may be improved.
We’ll also:
- give our expertise more prominence. The advice we give on health conditions and lifestyle have a 95%+ satisfaction rate but are “Never used” by 40-55% of respondents.
- review any areas for improvement with our delivery partners.
Open-ended responses: recurring feedback
Here we gave respondents the opportunity to be a little more specific about what they thought of us. We asked open-ended questions like “Do you have any concerns about Treated? (Write them below)” and “What was good about Treated? (Write this below)”.
We received some insightful and helpful comments here, and while we can’t address each-and-every response, we’ll discuss some common threads.
- Cost and pricing. Many respondents told us we’re expensive. Unfortunately, our prices are as low and competitive as they can be. Our prices are influenced by a range of factors, such as cost-price from our suppliers, inflation, and our commitment to providing an excellent private healthcare service. We do review our prices regularly however, to ensure we’re as competitive as possible.
- More frequency options. We’re continually looking to improve our formulary offering, and where it’s clinically possible, we’ll always try to give patients more options to make their treatment experience a better fit for their life. Sometimes, though, we need to limit how much medication we can offer at one time, to keep patients as safe as possible.
- Making it easier to change a subscription. We’re working on improving things here, optimising the flow to make pausing, cancelling, and changing more intuitive. We’ll still ask a couple of questions (so we can continue to learn and improve), but we’ll make the process smoother, quicker, and simpler going forward.
- Asking for ID. We need to make sure patients are who they say they are, to ensure we’re prescribing safely. We only ask, though, when we can’t confirm someone’s identity via our automatic checks. ID info isn’t stored any longer than it’s required to be by law, and we don’t share this info with anyone except external regulators.
Thank you to everyone who took part in our survey.
If you have any questions about the results, please contact us.
You can find our previous survey from 2023 here.
How we source info.
When we present you with stats, data, opinion or a consensus, we’ll tell you where this came from. And we’ll only present data as clinically reliable if it’s come from a reputable source, such as a state or government-funded health body, a peer-reviewed medical journal, or a recognised analytics or data body. Read more in our editorial policy.
Related articles


Give us the inbox treatment.
We're making healthcare more about you. Sign up to our newsletter for personalised health articles that make a difference.
Disclaimer: The information provided on this page is not a substitute for professional medical advice, diagnosis, or treatment. If you have any questions or concerns about your health, please talk to a doctor.
Find treatment


Treated
Authorised and Regulated by:

I'm looking for
Popular searches:
We couldn't find what you're looking for.
Here's everything we treat. Or, if you're looking for something we don't have yet, you can suggest something.
Choose your shipping location
Tell us about a problem
Sign up to our newsletter for all the latest on and more.
By clicking 'Subscribe now' you're agreeing to our Privacy Policy.
Reviews you can trust
- All of our reviews are collected from real patients after their treatment has been delivered.
- We publish reviews collected through independent platforms including Reviews.io and Trustpilot.
Last updated on Nov 27, 2025.
How we reviewed this page:
Nov 27, 2025
Published by: The Treated Content Team. Medically reviewed by: Patient satisfaction survey 2025,How we source info.
When we present you with stats, data, opinion or a consensus, we’ll tell you where this came from. And we’ll only present data as clinically reliable if it’s come from a reputable source, such as a state or government-funded health body, a peer-reviewed medical journal, or a recognised analytics or data body. Read more in our editorial policy.
Patient satisfaction survey 2025
Male health Female health General health UK Fact Checked Fact CheckedThis article has been fact checked by a licensed expert before publication to ensure all information provided is correct and safe. Patient satisfaction survey 2025 We believe that good health should be a two-way conversation. That’s why we periodically ask you, our patients, to […]
MeetHow we source info.
When we present you with stats, data, opinion or a consensus, we’ll tell you where this came from. And we’ll only present data as clinically reliable if it’s come from a reputable source, such as a state or government-funded health body, a peer-reviewed medical journal, or a recognised analytics or data body. Read more in our editorial policy.